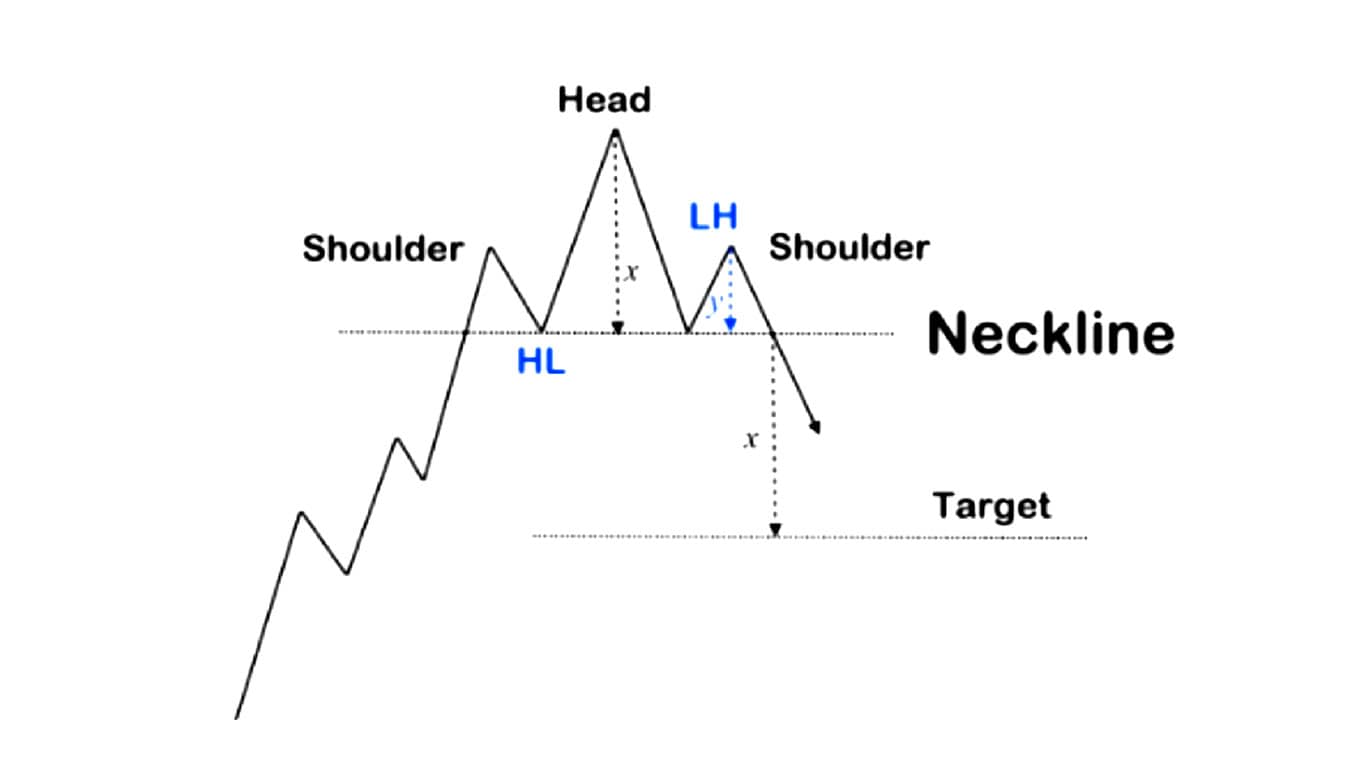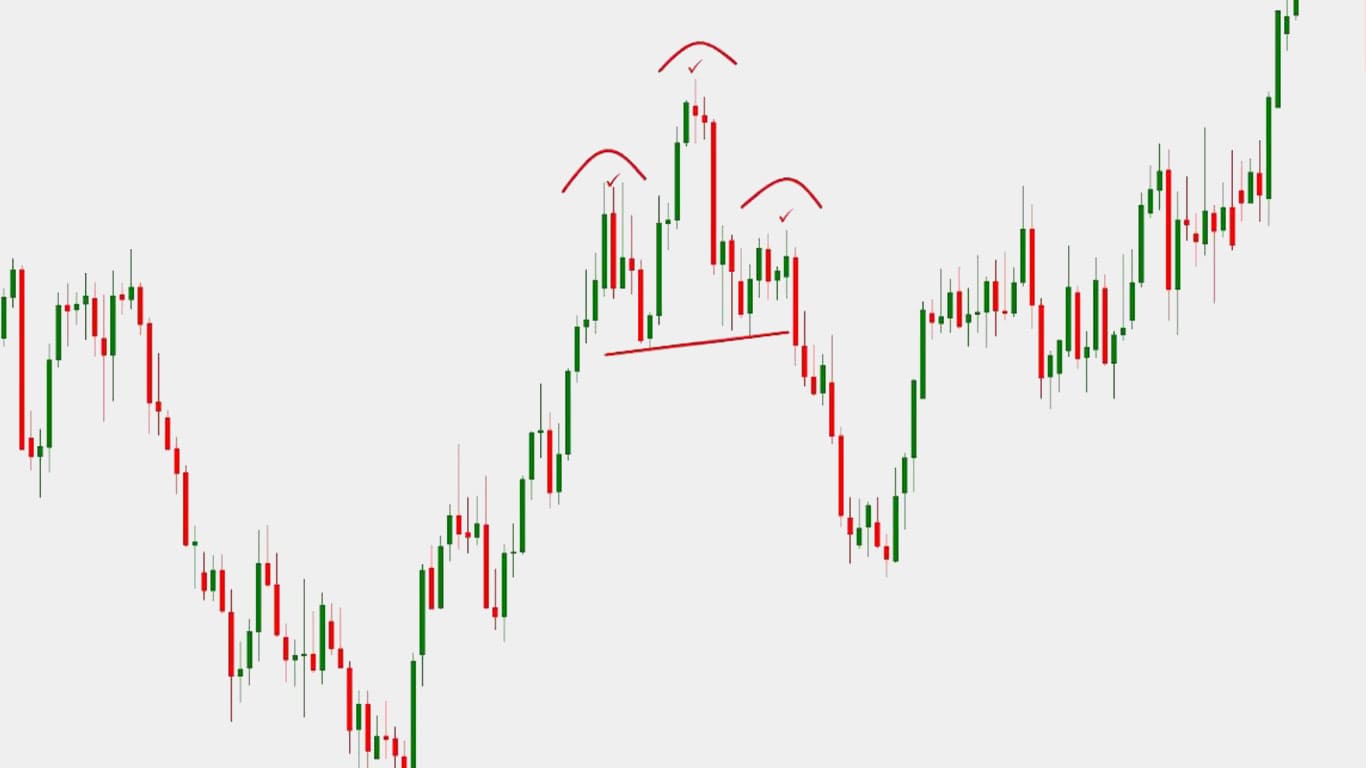
The head and shoulders pattern is a popular technical analysis pattern that can signal a trend reversal from bullish to bearish. It consists of three peaks with the middle peak (the head) being higher than the other two (the shoulders). Here’s how it typically forms:
Left Shoulder: The price of an asset is in an uptrend. It reaches a peak, then retraces somewhat forming the left shoulder.
Head: After the left shoulder, the price continues to rise, forming a higher peak known as the head. The head is typically the highest point in the pattern.
Right Shoulder: Following the head, the price declines again, but usually doesn’t fall as low as the previous trough. This forms the right shoulder, which is similar in height to the left shoulder.
Neckline: The neckline is a line drawn across the troughs of the left shoulder, head, and right shoulder. It serves as a support level for the pattern.
Confirmation: The pattern is confirmed when the price breaks below the neckline after the formation of the right shoulder. This break below the neckline is a signal that the uptrend has reversed, and a downtrend may follow.
Target: The price target for the pattern is often estimated by measuring the distance from the head to the neckline and subtracting it from the neckline’s breakout point.
It’s important to note that not all head and shoulders patterns lead to a reversal, and traders should use other technical analysis tools and indicators to confirm the pattern and assess its reliability. Additionally, variations such as inverse head and shoulders can occur, signaling a bullish reversal instead.

हेड एंड शोल्डर पैटर्न एक लोकप्रिय तकनीकी विश्लेषण पैटर्न है जो तेजी से मंदी की ओर रुझान के उलट होने का संकेत दे सकता है। इसमें तीन शिखर होते हैं जिनमें मध्य शिखर (सिर) अन्य दो (कंधों) से ऊंचा होता है। यहां बताया गया है कि यह आम तौर पर कैसे बनता है:
- बायां कंधा: किसी परिसंपत्ति की कीमत तेजी की ओर है। यह चरम पर पहुंचता है, फिर कुछ हद तक पीछे हटकर बाएं कंधे का निर्माण करता है।
- हेड: बाएं कंधे के बाद, कीमत में वृद्धि जारी रहती है, जिससे एक उच्च शिखर बनता है जिसे हेड के रूप में जाना जाता है। सिर आमतौर पर पैटर्न में उच्चतम बिंदु होता है।
- दायां कंधा: सिर के बाद, कीमत फिर से गिरती है, लेकिन आमतौर पर पिछले गर्त जितनी कम नहीं होती है। इससे दायां कंधा बनता है, जिसकी ऊंचाई बाएं कंधे के समान होती है।
- नेकलाइन: नेकलाइन बाएं कंधे, सिर और दाएं कंधे के निचले हिस्से में खींची गई एक रेखा है। यह पैटर्न के लिए समर्थन स्तर के रूप में कार्य करता है।
- पुष्टिकरण: पैटर्न की पुष्टि तब की जाती है जब दाहिने कंधे के गठन के बाद कीमत नेकलाइन के नीचे टूट जाती है। नेकलाइन के नीचे यह टूटना एक संकेत है कि अपट्रेंड उलट गया है, और इसके बाद डाउनट्रेंड आ सकता है।
- लक्ष्य: पैटर्न के लिए मूल्य लक्ष्य का अनुमान अक्सर सिर से नेकलाइन तक की दूरी को मापकर और नेकलाइन के ब्रेकआउट बिंदु से घटाकर लगाया जाता है।
यह ध्यान रखना महत्वपूर्ण है कि सभी सिर और कंधों के पैटर्न उलट नहीं होते हैं, और व्यापारियों को पैटर्न की पुष्टि करने और इसकी विश्वसनीयता का आकलन करने के लिए अन्य तकनीकी विश्लेषण उपकरणों और संकेतकों का उपयोग करना चाहिए। इसके अतिरिक्त, उलटा सिर और कंधे जैसी भिन्नताएं हो सकती हैं, जो तेजी से उलटफेर का संकेत देती हैं।


