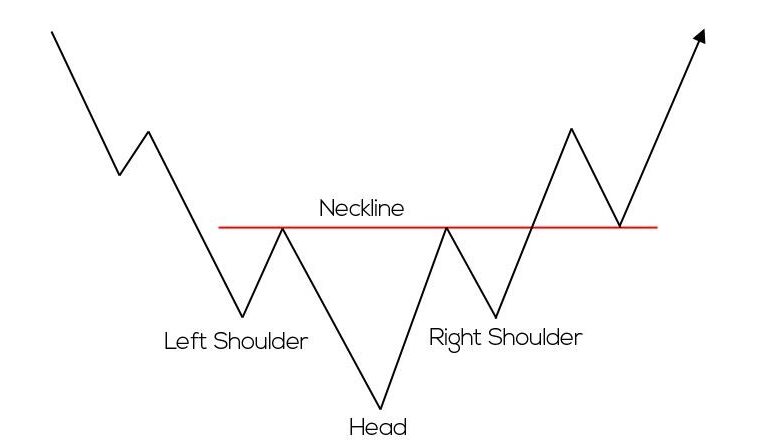
The inverse head and shoulders pattern is the bullish counterpart to the regular head and shoulders pattern. It typically forms after a downtrend and signals a potential trend reversal to the upside. Here’s how it generally unfolds:
Left Shoulder: The price of an asset is in a downtrend. It reaches a trough, then retraces somewhat forming the left shoulder.
Head: After the left shoulder, the price continues to decline, forming a lower trough known as the head. The head is typically the lowest point in the pattern.
Right Shoulder: Following the head, the price rises again, but usually doesn’t reach as high as the previous peak. This forms the right shoulder, which is similar in height to the left shoulder.
Neckline: Similar to the head and shoulders pattern, the neckline is drawn across the peaks of the left shoulder, head, and right shoulder. It serves as a resistance level for the pattern.
Confirmation: The pattern is confirmed when the price breaks above the neckline after the formation of the right shoulder. This break above the neckline is a signal that the downtrend has reversed, and an uptrend may follow.
Target: The price target for the pattern is often estimated by measuring the distance from the head to the neckline and adding it to the neckline’s breakout point.
As with any technical analysis pattern, it’s essential to confirm the inverse head and shoulders pattern with other indicators or analysis methods before making trading decisions. While the pattern can be a strong signal of a potential trend reversal, false breakouts and failed patterns can occur, so traders should exercise caution and use risk management strategies.

उलटा सिर और कंधे का पैटर्न नियमित सिर और कंधे के पैटर्न का तेजी से समकक्ष है। यह आम तौर पर गिरावट की प्रवृत्ति के बाद बनता है और संभावित प्रवृत्ति के उल्टा होने का संकेत देता है। यहां बताया गया है कि यह आम तौर पर कैसे सामने आता है:
- बायां कंधा: किसी संपत्ति की कीमत में गिरावट का रुख है। यह एक गर्त तक पहुंचता है, फिर बाएं कंधे का निर्माण करते हुए कुछ हद तक पीछे हट जाता है।
- हेड: बाएं कंधे के बाद, कीमत में गिरावट जारी है, जिससे एक निचला गर्त बनता है जिसे हेड के रूप में जाना जाता है। सिर आमतौर पर पैटर्न में सबसे निचला बिंदु होता है।
- दायां कंधा: सिर के बाद, कीमत फिर से बढ़ती है, लेकिन आमतौर पर पिछले शिखर जितनी ऊंचाई तक नहीं पहुंचती है। इससे दायां कंधा बनता है, जिसकी ऊंचाई बाएं कंधे के समान होती है।
- नेकलाइन: सिर और कंधों के पैटर्न के समान, नेकलाइन बाएं कंधे, सिर और दाएं कंधे की चोटियों पर खींची जाती है। यह पैटर्न के लिए प्रतिरोध स्तर के रूप में कार्य करता है।
- पुष्टिकरण: पैटर्न की पुष्टि तब की जाती है जब दाहिने कंधे के गठन के बाद कीमत नेकलाइन से ऊपर टूट जाती है। नेकलाइन के ऊपर यह टूटना एक संकेत है कि डाउनट्रेंड उलट गया है, और इसके बाद अपट्रेंड आ सकता है।
- लक्ष्य: पैटर्न के लिए मूल्य लक्ष्य का अनुमान अक्सर सिर से नेकलाइन तक की दूरी को मापकर और इसे नेकलाइन के ब्रेकआउट बिंदु पर जोड़कर लगाया जाता है।
किसी भी तकनीकी विश्लेषण पैटर्न की तरह, व्यापारिक निर्णय लेने से पहले अन्य संकेतकों या विश्लेषण विधियों के साथ व्युत्क्रम सिर और कंधों के पैटर्न की पुष्टि करना आवश्यक है। जबकि पैटर्न संभावित प्रवृत्ति के उलट होने का एक मजबूत संकेत हो सकता है, गलत ब्रेकआउट और असफल पैटर्न हो सकते हैं, इसलिए व्यापारियों को सावधानी बरतनी चाहिए और जोखिम प्रबंधन रणनीतियों का उपयोग करना चाहिए।


