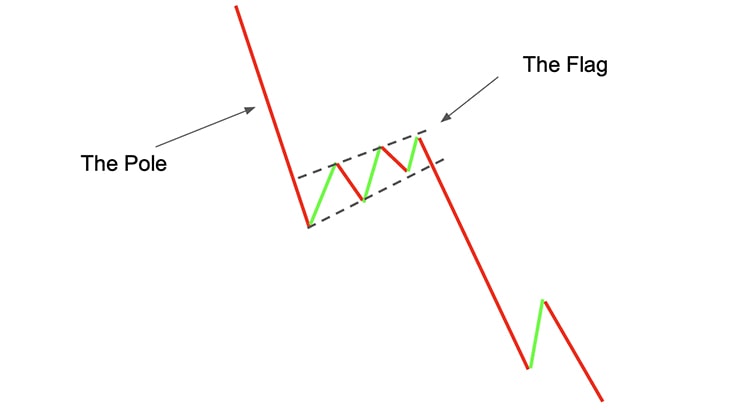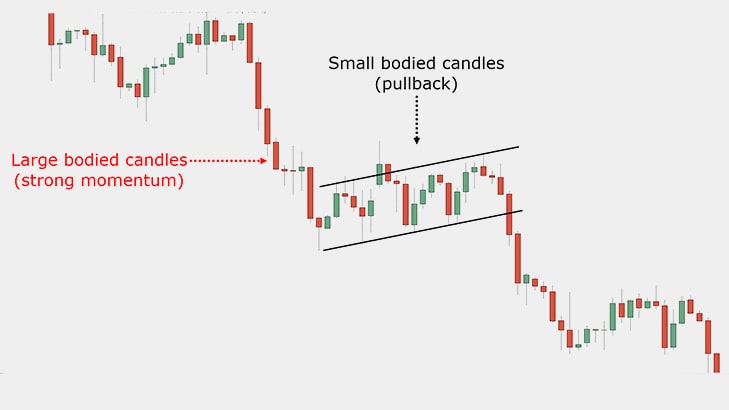
The bearish flag chart pattern is a technical analysis pattern that typically forms after a significant downward price movement in a financial market. It’s called a “bearish” flag because it often signals a continuation of the previous downtrend.
Here’s how it typically looks:
Flagpole: The flagpole is formed by a sharp, significant price decline, usually accompanied by high trading volume. This represents the initial strong selling pressure.
Flag: After the initial decline, the price consolidates in a narrow range, forming a rectangular or parallelogram-shaped pattern, which is referred to as the flag. During this consolidation phase, trading volume tends to diminish, indicating a temporary pause in the selling pressure.
Breakdown: The pattern concludes with a breakout to the downside, where the price resumes its downward movement, often with increased volume. This breakout confirms the continuation of the bearish trend.
Traders typically look for this pattern to enter short positions (selling), anticipating further price declines. However, it’s essential to remember that not all flag patterns result in a continuation of the downtrend. Like all technical analysis patterns, it’s crucial to consider other indicators and factors before making trading decisions.

बियरिश फ़्लैग चार्ट पैटर्न एक तकनीकी विश्लेषण पैटर्न है जो आम तौर पर वित्तीय बाज़ार में महत्वपूर्ण गिरावट के बाद बनता है। इसे “मंदी” ध्वज कहा जाता है क्योंकि यह अक्सर पिछले डाउनट्रेंड की निरंतरता का संकेत देता है।
यहां बताया गया है कि यह आम तौर पर कैसा दिखता है:
- फ़्लैगपोल: फ़्लैगपोल का निर्माण तेज़, महत्वपूर्ण कीमत में गिरावट से होता है, जो आमतौर पर उच्च ट्रेडिंग वॉल्यूम के साथ होता है। यह शुरुआती मजबूत बिकवाली दबाव को दर्शाता है।
- ध्वज: प्रारंभिक गिरावट के बाद, कीमत एक संकीर्ण सीमा में समेकित हो जाती है, जिससे एक आयताकार या समांतर चतुर्भुज-आकार का पैटर्न बनता है, जिसे ध्वज कहा जाता है। इस समेकन चरण के दौरान, ट्रेडिंग वॉल्यूम कम हो जाता है, जो बिक्री दबाव में अस्थायी ठहराव का संकेत देता है।
- ब्रेकडाउन: पैटर्न नकारात्मक पक्ष के ब्रेकआउट के साथ समाप्त होता है, जहां कीमत अपने नीचे की ओर बढ़ना शुरू कर देती है, अक्सर बढ़ी हुई मात्रा के साथ। यह ब्रेकआउट मंदी की प्रवृत्ति के जारी रहने की पुष्टि करता है।
व्यापारी आम तौर पर कीमतों में और गिरावट की आशंका से शॉर्ट पोजीशन (बिक्री) में प्रवेश करने के लिए इस पैटर्न की तलाश करते हैं। हालाँकि, यह याद रखना आवश्यक है कि सभी ध्वज पैटर्न के परिणामस्वरूप डाउनट्रेंड जारी नहीं रहता है। सभी तकनीकी विश्लेषण पैटर्न की तरह, व्यापारिक निर्णय लेने से पहले अन्य संकेतकों और कारकों पर विचार करना महत्वपूर्ण है।


