A Bullish Engulfing pattern is a strong bullish reversal candlestick pattern that appears at the end of a downtrend, indicating a potential reversal in market sentiment. It is considered one of the most reliable reversal patterns in technical analysis. Here’s a detailed look at its characteristics, interpretation, and trading strategy:
Key Features of a Bullish Engulfing Pattern
Two Candlesticks: The pattern consists of two candles:
- The first candle is bearish, usually a small red or black candle, indicating continuation of the downtrend.
- The second candle is bullish, usually a large green or white candle, which completely engulfs the body of the first candle.
Positioning:
- The bearish candle closes lower than it opens, typically with a small body.
- The bullish candle opens lower than the previous close and closes higher than the previous open, engulfing the entire body of the first candle.
Volume: Higher trading volume during the formation of the bullish candle adds strength to the pattern, indicating strong buying interest.
Interpretation and Significance
Bullish Reversal: The Bullish Engulfing pattern suggests a shift in market sentiment from bearish to bullish. The first candle shows the bears’ control, but the second candle indicates that the bulls have taken over, with the price closing higher than the previous candle’s open.
Confirmation: For added confidence, traders often look for confirmation through additional bullish candles or increased volume in the following sessions.

Example
Consider a stock in a downtrend with the following candlestick behavior:
- Day 1: The stock opens at $100, drops, and closes at $90, forming a small bearish candle.
- Day 2: The stock opens at $88 (below the previous day’s close), but buyers push the price up to close at $105, completely engulfing the body of the previous day’s candle.
This pattern forms a Bullish Engulfing pattern and suggests a potential bullish reversal.
Trading Strategy
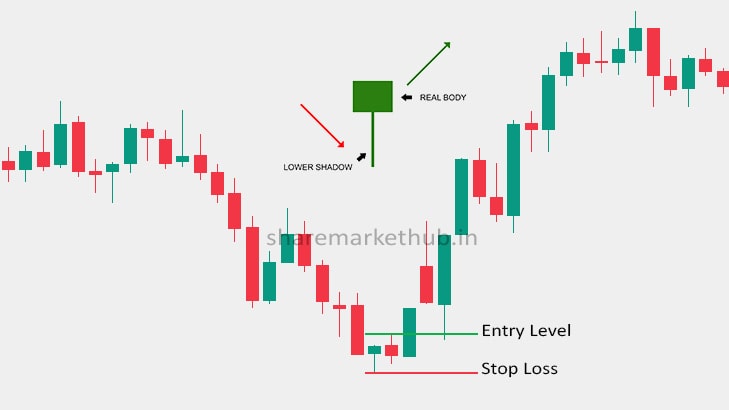
- Entry Point: Traders might enter a long position at the opening of the next candle after the Bullish Engulfing pattern is confirmed, particularly if it opens higher than the close of the bullish candle.
- Stop Loss: A common strategy is to place a stop loss below the low of the bullish engulfing candle to limit potential losses.
- Target: The target price can be set based on key resistance levels, previous highs, or a predefined risk-reward ratio.
Conclusion
The Bullish Engulfing pattern is a reliable indicator of a potential reversal from a downtrend to an uptrend. However, it should be used in conjunction with other technical analysis tools and indicators to increase the probability of successful trades. As with any trading strategy, proper risk management is essential to mitigate potential losses.
बुलिश एनगल्फिंग पैटर्न एक मजबूत बुलिश रिवर्सल कैंडलस्टिक पैटर्न है जो डाउनट्रेंड के अंत में दिखाई देता है, जो बाजार की भावना में संभावित उलटफेर का संकेत देता है। इसे तकनीकी विश्लेषण में सबसे विश्वसनीय रिवर्सल पैटर्न में से एक माना जाता है। यहाँ इसकी विशेषताओं, व्याख्या और ट्रेडिंग रणनीति पर एक विस्तृत नज़र डाली गई है:
बुलिश एनगल्फिंग पैटर्न की मुख्य विशेषताएँ
1. दो कैंडलस्टिक्स: पैटर्न में दो कैंडल होती हैं:
- पहली कैंडल मंदी वाली होती है, आमतौर पर एक छोटी लाल या काली कैंडल होती है, जो डाउनट्रेंड की निरंतरता का संकेत देती है।
- दूसरी कैंडल तेजी वाली होती है, आमतौर पर एक बड़ी हरी या सफेद कैंडल होती है, जो पहली कैंडल की बॉडी को पूरी तरह से घेर लेती है।
2. पोजिशनिंग:
- बेयरिश कैंडल खुलने की तुलना में कम पर बंद होती है, आमतौर पर एक छोटी बॉडी के साथ।
- बुलिश कैंडल पिछले क्लोज से कम खुलती है और पिछले ओपन से ज़्यादा पर बंद होती है, जो पहली कैंडल की पूरी बॉडी को घेर लेती है।
3. वॉल्यूम: बुलिश कैंडल के निर्माण के दौरान ज़्यादा ट्रेडिंग वॉल्यूम पैटर्न को मज़बूती देता है, जो मज़बूत खरीदारी रुचि का संकेत देता है।
व्याख्या और महत्व
- बुलिश रिवर्सल: बुलिश एनगल्फिंग पैटर्न बाजार की धारणा में मंदी से तेजी की ओर बदलाव का संकेत देता है। पहली मोमबत्ती भालू के नियंत्रण को दर्शाती है, लेकिन दूसरी मोमबत्ती संकेत देती है कि बैल ने नियंत्रण ले लिया है, जिसमें कीमत पिछली मोमबत्ती के खुलने की तुलना में अधिक बंद हो रही है।
- पुष्टि: अधिक आत्मविश्वास के लिए, व्यापारी अक्सर अगले सत्रों में अतिरिक्त तेजी वाली मोमबत्तियों या बढ़ी हुई मात्रा के माध्यम से पुष्टि की तलाश करते हैं।
उदाहरण
निम्नलिखित कैंडलस्टिक व्यवहार के साथ डाउनट्रेंड में एक स्टॉक पर विचार करें:
1. दिन 1: स्टॉक $100 पर खुलता है, गिरता है, और $90 पर बंद होता है, जिससे एक छोटी मंदी वाली कैंडल बनती है।
2. दिन 2: स्टॉक $88 (पिछले दिन के बंद से नीचे) पर खुलता है, लेकिन खरीदार कीमत को $105 पर बंद करने के लिए बढ़ाते हैं, जो पिछले दिन की कैंडल की बॉडी को पूरी तरह से घेर लेती है।
यह पैटर्न एक बुलिश एंग्ल्फिंग पैटर्न बनाता है और संभावित तेजी से उलटफेर का सुझाव देता है।
ट्रेडिंग रणनीति
- प्रवेश बिंदु: बुलिश एंग्ल्फिंग पैटर्न की पुष्टि होने के बाद ट्रेडर अगली कैंडल के खुलने पर एक लंबी स्थिति में प्रवेश कर सकते हैं, खासकर अगर यह बुलिश कैंडल के बंद होने से अधिक खुलता है।
- स्टॉप लॉस: संभावित नुकसान को सीमित करने के लिए बुलिश एंग्ल्फिंग कैंडल के निचले स्तर से नीचे स्टॉप लॉस लगाना एक आम रणनीति है।
- लक्ष्य: लक्ष्य मूल्य को प्रमुख प्रतिरोध स्तरों, पिछले उच्च स्तर या पूर्वनिर्धारित जोखिम-इनाम अनुपात के आधार पर सेट किया जा सकता है।
निष्कर्ष
बुलिश एंगुलफिंग पैटर्न डाउनट्रेंड से अपट्रेंड में संभावित उलटफेर का एक विश्वसनीय संकेतक है। हालाँकि, सफल ट्रेड की संभावना बढ़ाने के लिए इसे अन्य तकनीकी विश्लेषण टूल और संकेतकों के साथ संयोजन में उपयोग किया जाना चाहिए। किसी भी ट्रेडिंग रणनीति की तरह, संभावित नुकसान को कम करने के लिए उचित जोखिम प्रबंधन आवश्यक है।