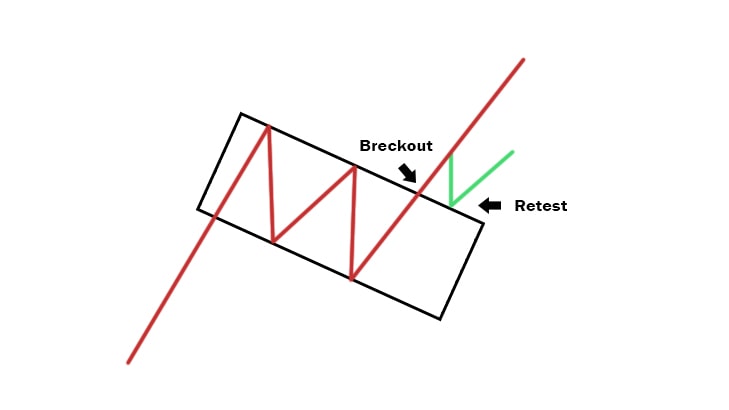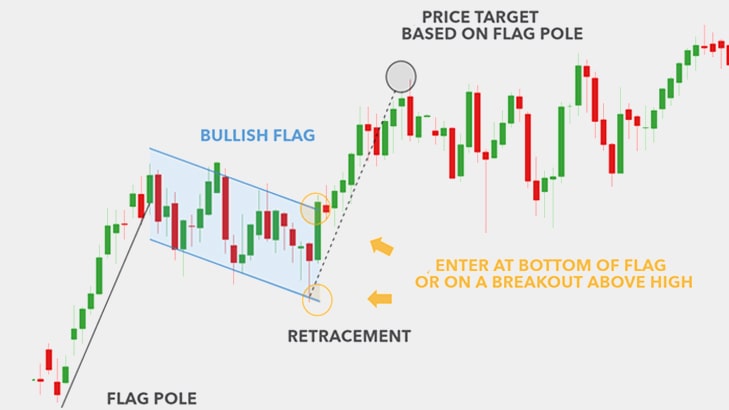
The bullish flag chart pattern is a continuation pattern observed in technical analysis, indicating a temporary pause in an uptrend before the price resumes its upward movement. It resembles a flagpole and a flag, hence the name.
Here’s a breakdown of the bullish flag pattern:
Formation:
- Flagpole: The pattern begins with a strong upward price movement, known as the flagpole. This rapid ascent often represents a significant surge in buying pressure.
- Flag: Following the flagpole, the price enters a consolidation phase, forming a rectangular or sloping pattern that resembles a flag. This consolidation is characterized by lower trading volumes and typically has parallel trendlines.
Key Features:
- Flagpole Height: The height of the flagpole indicates the magnitude of the preceding uptrend. A taller flagpole suggests a more robust uptrend.
- Consolidation Phase: The flag portion of the pattern represents a period of market consolidation and profit-taking, where traders reassess their positions before deciding on the next move.
- Parallel Trendlines: The flag pattern is bounded by two parallel trendlines, with the upper trendline acting as resistance and the lower trendline acting as support.
Significance:
- The bullish flag pattern suggests that despite the temporary pause in the uptrend, bullish sentiment remains intact.
- It reflects a period of market consolidation and profit-taking, allowing traders to digest recent gains before pushing the price higher.
- The pattern is considered a continuation signal, indicating that once the consolidation phase is over, the uptrend is likely to resume.
Trading Strategy:
- Entry: Traders often wait for a breakout above the upper trendline of the flag to confirm the continuation of the uptrend.
- Confirmation: A valid breakout should be accompanied by increased trading volume, signaling renewed buying interest.
- Stop-Loss: Stop-loss orders are typically placed below the lower trendline of the flag to manage risk in case of a false breakout or sudden reversal.
- Target Price: The target price for the bullish flag pattern can be estimated by measuring the height of the flagpole and projecting it upward from the breakout point. This provides a potential upside target for profit-taking.
As with any technical analysis pattern, traders should use the bullish flag pattern in conjunction with other indicators and analysis techniques for confirmation and risk management. False breakouts and market volatility can impact the reliability of the pattern, so prudent trading strategies are essential.

बुलिश फ़्लैग चार्ट पैटर्न तकनीकी विश्लेषण में देखा गया एक निरंतरता पैटर्न है, जो कीमत के ऊपर की ओर बढ़ने से पहले एक अपट्रेंड में अस्थायी ठहराव का संकेत देता है। यह एक झंडे और झंडे जैसा दिखता है, इसलिए इसे यह नाम दिया गया है।
यहां बुलिश फ़्लैग पैटर्न का विवरण दिया गया है:
गठन:
- फ़्लैगपोल: पैटर्न एक मजबूत ऊपर की ओर मूल्य आंदोलन के साथ शुरू होता है, जिसे फ़्लैगपोल के रूप में जाना जाता है। यह तीव्र वृद्धि अक्सर खरीदारी के दबाव में एक महत्वपूर्ण उछाल का प्रतिनिधित्व करती है।
- ध्वज: ध्वजदंड के बाद, कीमत एक समेकन चरण में प्रवेश करती है, जो एक आयताकार या ढलान वाला पैटर्न बनाती है जो ध्वज जैसा दिखता है। इस समेकन की विशेषता कम ट्रेडिंग वॉल्यूम है और इसमें आम तौर पर समानांतर प्रवृत्ति रेखाएं होती हैं।
प्रमुख विशेषताऐं:
- फ़्लैगपोल की ऊँचाई: फ़्लैगपोल की ऊँचाई पूर्ववर्ती अपट्रेंड की भयावहता को इंगित करती है। एक लंबा फ़्लैगपोल अधिक मजबूत अपट्रेंड का सुझाव देता है।
- समेकन चरण: पैटर्न का ध्वज भाग बाजार समेकन और लाभ लेने की अवधि का प्रतिनिधित्व करता है, जहां व्यापारी अगले कदम पर निर्णय लेने से पहले अपनी स्थिति का पुनर्मूल्यांकन करते हैं।
- समानांतर ट्रेंडलाइन: ध्वज पैटर्न दो समानांतर ट्रेंडलाइन से घिरा होता है, जिसमें ऊपरी ट्रेंडलाइन प्रतिरोध के रूप में कार्य करती है और निचली ट्रेंडलाइन समर्थन के रूप में कार्य करती है।
महत्व:
- तेजी के ध्वज पैटर्न से पता चलता है कि तेजी की प्रवृत्ति में अस्थायी ठहराव के बावजूद तेजी की भावना बरकरार है।
- यह बाजार के समेकन और लाभ लेने की अवधि को दर्शाता है, जिससे व्यापारियों को कीमत बढ़ाने से पहले हाल के लाभ को पचाने की अनुमति मिलती है।
- पैटर्न को एक निरंतरता संकेत माना जाता है, जो दर्शाता है कि एक बार समेकन चरण समाप्त होने के बाद, अपट्रेंड फिर से शुरू होने की संभावना है।
ट्रेडिंग रणनीति:
- प्रवेश: व्यापारी अक्सर अपट्रेंड की निरंतरता की पुष्टि करने के लिए ध्वज की ऊपरी ट्रेंडलाइन के ऊपर ब्रेकआउट की प्रतीक्षा करते हैं।
- पुष्टिकरण: एक वैध ब्रेकआउट के साथ बढ़ी हुई ट्रेडिंग मात्रा होनी चाहिए, जो नए सिरे से खरीदारी में दिलचस्पी का संकेत हो।
- स्टॉप-लॉस: गलत ब्रेकआउट या अचानक उलट होने की स्थिति में जोखिम का प्रबंधन करने के लिए स्टॉप-लॉस ऑर्डर आमतौर पर ध्वज की निचली ट्रेंडलाइन के नीचे रखे जाते हैं।
- लक्ष्य मूल्य: बुलिश फ़्लैग पैटर्न के लिए लक्ष्य मूल्य का अनुमान फ़्लैगपोल की ऊंचाई को मापकर और इसे ब्रेकआउट बिंदु से ऊपर की ओर प्रक्षेपित करके लगाया जा सकता है। यह लाभ कमाने के लिए एक संभावित उल्टा लक्ष्य प्रदान करता है।
किसी भी तकनीकी विश्लेषण पैटर्न की तरह, व्यापारियों को पुष्टि और जोखिम प्रबंधन के लिए अन्य संकेतकों और विश्लेषण तकनीकों के साथ तेजी से ध्वज पैटर्न का उपयोग करना चाहिए। गलत ब्रेकआउट और बाज़ार की अस्थिरता पैटर्न की विश्वसनीयता को प्रभावित कर सकती है, इसलिए विवेकपूर्ण ट्रेडिंग रणनीतियाँ आवश्यक हैं।


