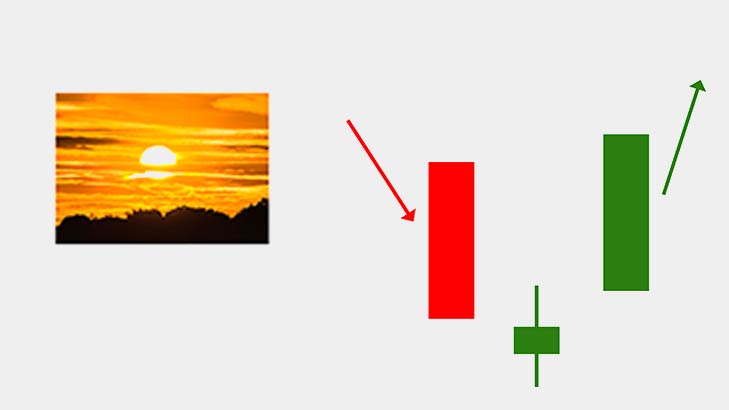
The bullish harami pattern is a two candlestick chart pattern that shows a bullish reversal when it appears during a downtrend. The first candle is a large red candle, and the second candle is a bullish little candle that forms within the previous candle’s body’s range. The first candle indicates a bearish trend, and the second green candle signals the beginning of a bullish trend.
बुलिश हरामी
बुलिश हरामी पैटर्न एक दो कैंडलस्टिक चार्ट पैटर्न है जो डाउनट्रेंड के दौरान दिखाई देने पर तेजी से उलटफेर दिखाता है। पहली मोमबत्ती एक बड़ी लाल मोमबत्ती है, और दूसरी मोमबत्ती एक तेज़ छोटी मोमबत्ती है जो पिछली मोमबत्ती के शरीर की सीमा के भीतर बनती है। पहली मोमबत्ती मंदी की प्रवृत्ति का संकेत देती है, और दूसरी हरी मोमबत्ती तेजी की प्रवृत्ति की शुरुआत का संकेत देती है।