The Bullish Harami candlestick pattern is a two-candle bullish reversal pattern that typically forms at the bottom of a downtrend. The pattern signals a potential reversal in the bearish trend and a shift towards bullish sentiment.
Characteristics of the Bullish Harami Pattern
- First Candle:
- The first candle is a long bearish candle, indicating strong selling pressure.
- Second Candle:
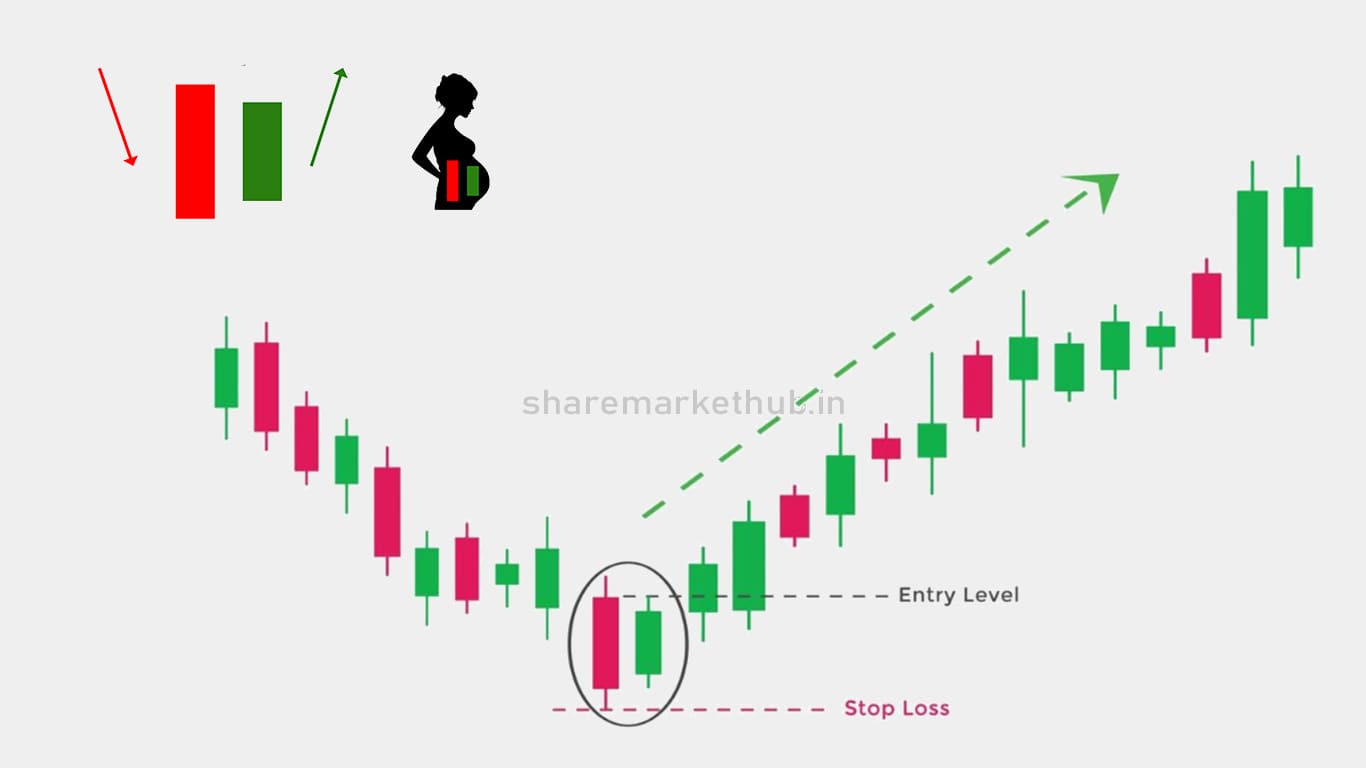
- The second candle is a small bullish (or sometimes bearish) candle that is completely contained within the body of the first candle. This means the high and low of the second candle are within the range of the first candle.
Interpretation and Significance
- Indication of Reversal: The Bullish Harami pattern suggests that the selling momentum is slowing down, and buyers are starting to step in.
- Change in Sentiment: The pattern reflects indecision and a potential shift from bearish to bullish sentiment.
Example of a Bullish Harami Pattern
Imagine a stock in a downtrend. On Day 1, a long bearish candle forms. On Day 2, a small bullish candle forms entirely within the body of the previous bearish candle. This sequence of candles would be identified as a Bullish Harami pattern.
Trading the Bullish Harami Pattern
- Identify the Pattern: Look for the two-candle formation at the bottom of a downtrend.
- Confirm the Signal: Use additional technical indicators (like RSI, MACD) or volume analysis to confirm the potential reversal.
- Enter the Trade: Consider entering a long position at the close of the second candle or at the opening of the next candle.
- Set a Stop-Loss: Place a stop-loss below the low of the first candle to manage risk.
- Set a Profit Target: Use previous resistance levels or a risk-reward ratio to set a profit target.
Tips for Trading
- Volume Confirmation: Higher volume on the second candle can strengthen the reliability of the pattern.
- Combining with Other Indicators: Use the Bullish Harami pattern in conjunction with other technical indicators to confirm the reversal.
Example in a Chart
In a typical chart, the Bullish Harami pattern might look like this:
- Day 1: A long bearish candle forms, continuing the downtrend.
- Day 2: A small bullish candle forms within the body of the previous candle.
The Bullish Harami pattern is a useful tool for traders to identify potential bullish reversals, especially when combined with other forms of technical analysis.
बुलिश हरामी कैंडलस्टिक पैटर्न एक दो-कैंडल बुलिश रिवर्सल पैटर्न है जो आमतौर पर डाउनट्रेंड के निचले भाग में बनता है। यह पैटर्न मंदी के रुझान में संभावित उलटफेर और तेजी की भावना की ओर बदलाव का संकेत देता है।
बुलिश हरामी पैटर्न की विशेषताएँ
1. पहली कैंडल:
पहली कैंडल एक लंबी मंदी की कैंडल होती है, जो मजबूत बिक्री दबाव का संकेत देती है।
2. दूसरी कैंडल:
दूसरी कैंडल एक छोटी तेजी (या कभी-कभी मंदी) वाली कैंडल होती है जो पूरी तरह से पहली कैंडल के शरीर के भीतर समाहित होती है। इसका मतलब है कि दूसरी कैंडल का उच्च और निम्न पहली कैंडल की सीमा के भीतर होता है।
व्याख्या और महत्व
उलटफेर का संकेत: बुलिश हरामी पैटर्न बताता है कि बिक्री की गति धीमी हो रही है, और खरीदार आगे आने लगे हैं।
भावना में बदलाव: पैटर्न अनिर्णय और मंदी से तेजी की भावना में संभावित बदलाव को दर्शाता है।
बुलिश हरामी पैटर्न का उदाहरण
एक स्टॉक की कल्पना करें जो डाउनट्रेंड में है। पहले दिन, एक लंबी मंदी वाली मोमबत्ती बनती है। दूसरे दिन, एक छोटी तेजी वाली मोमबत्ती पूरी तरह से पिछली मंदी वाली मोमबत्ती के शरीर के भीतर बनती है। मोमबत्तियों के इस क्रम को बुलिश हरामी पैटर्न के रूप में पहचाना जाएगा।
बुलिश हरामी पैटर्न का व्यापार
पैटर्न की पहचान करें: डाउनट्रेंड के निचले भाग में दो-मोमबत्ती के गठन को देखें।
संकेत की पुष्टि करें: संभावित उलटफेर की पुष्टि करने के लिए अतिरिक्त तकनीकी संकेतक (जैसे RSI, MACD) या वॉल्यूम विश्लेषण का उपयोग करें।
ट्रेड में प्रवेश करें: दूसरी मोमबत्ती के बंद होने पर या अगली मोमबत्ती के खुलने पर एक लंबी स्थिति में प्रवेश करने पर विचार करें।
स्टॉप-लॉस सेट करें: जोखिम को प्रबंधित करने के लिए पहली मोमबत्ती के निचले भाग के नीचे स्टॉप-लॉस रखें।
लाभ लक्ष्य निर्धारित करें: लाभ लक्ष्य निर्धारित करने के लिए पिछले प्रतिरोध स्तरों या जोखिम-इनाम अनुपात का उपयोग करें।
ट्रेडिंग के लिए सुझाव
वॉल्यूम की पुष्टि: दूसरी मोमबत्ती पर उच्च वॉल्यूम पैटर्न की विश्वसनीयता को मजबूत कर सकता है।
अन्य संकेतकों के साथ संयोजन: रिवर्सल की पुष्टि करने के लिए अन्य तकनीकी संकेतकों के साथ संयोजन में बुलिश हरामी पैटर्न का उपयोग करें।
चार्ट में उदाहरण
एक सामान्य चार्ट में, बुलिश हरामी पैटर्न इस तरह दिख सकता है:
दिन 1: डाउनट्रेंड को जारी रखते हुए एक लंबी मंदी वाली मोमबत्ती बनती है।
दिन 2: पिछली मोमबत्ती के शरीर के भीतर एक छोटी तेजी वाली मोमबत्ती बनती है।
बुलिश हरामी पैटर्न व्यापारियों के लिए संभावित तेजी वाले रिवर्सल की पहचान करने के लिए एक उपयोगी उपकरण है, खासकर जब तकनीकी विश्लेषण के अन्य रूपों के साथ संयुक्त किया जाता है।


