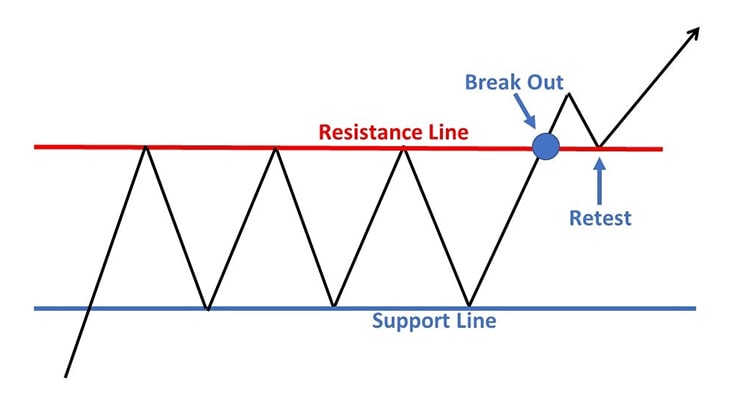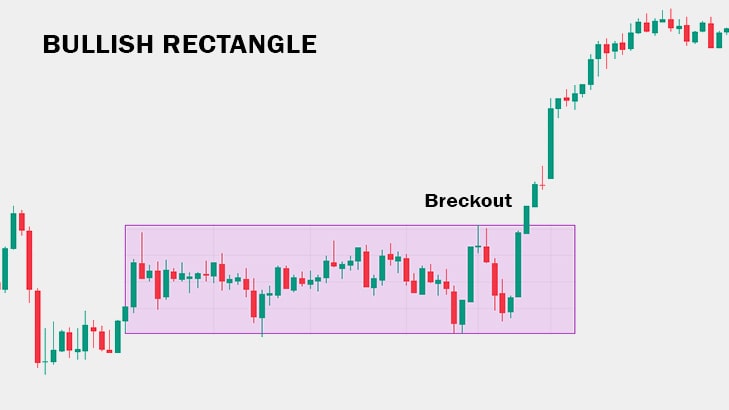
The bullish rectangle chart pattern is a continuation pattern that typically forms during an uptrend, suggesting a temporary pause in the price movement before the uptrend resumes. Here’s an overview:
Formation: A bullish rectangle pattern forms when the price of an asset consolidates within a rectangular-shaped pattern, bounded by parallel horizontal trendlines. These trendlines act as support and resistance levels, with the upper trendline acting as resistance and the lower trendline acting as support.
Duration: The duration of the pattern can vary, but it typically lasts for several weeks to several months, representing a period of consolidation or sideways movement within the context of an uptrend.
Volume Analysis: Volume analysis is essential in confirming the validity of the bullish rectangle pattern. During the consolidation phase, volume tends to decrease, indicating a lack of significant selling pressure. However, when the price breaks out of the pattern, volume should ideally increase, confirming the bullish continuation.
Breakout: The confirmation of a bullish rectangle pattern occurs when the price breaks out above the upper trendline, signaling the continuation of the uptrend. Traders often look for a decisive close above the upper trendline accompanied by increased volume to confirm the breakout.
Price Target: The price target for a bullish rectangle pattern is often measured by adding the height of the rectangle (the distance between the support and resistance levels) to the breakout point. This provides traders with an estimate of how far the price may move following the breakout.
False Breakouts: False breakouts can occur, where the price briefly moves above the upper trendline but then reverses back into the pattern. Traders should wait for confirmation before taking action, ensuring that the breakout is supported by strong volume and price momentum.
Pattern Failure: In some cases, the bullish rectangle pattern may fail to produce the expected bullish continuation. If the price breaks down below the lower trendline instead of above the upper one, it could signal a failed pattern. This could indicate a potential trend reversal or a prolonged period of consolidation.
As with any technical analysis pattern, it’s important to use the bullish rectangle pattern in conjunction with other analysis tools and indicators to increase the probability of successful trades.

बुलिश रेक्टेंगल चार्ट पैटर्न एक निरंतरता पैटर्न है जो आम तौर पर अपट्रेंड के दौरान बनता है, जो अपट्रेंड फिर से शुरू होने से पहले मूल्य आंदोलन में एक अस्थायी ठहराव का सुझाव देता है। यहाँ एक सिंहावलोकन है:
- गठन: एक तेजी से आयताकार पैटर्न तब बनता है जब किसी परिसंपत्ति की कीमत एक आयताकार आकार के पैटर्न के भीतर समेकित होती है, जो समानांतर क्षैतिज प्रवृत्ति रेखाओं से घिरी होती है। ये ट्रेंडलाइन समर्थन और प्रतिरोध स्तर के रूप में कार्य करती हैं, ऊपरी ट्रेंडलाइन प्रतिरोध के रूप में कार्य करती है और निचली ट्रेंडलाइन समर्थन के रूप में कार्य करती है।
- अवधि: पैटर्न की अवधि अलग-अलग हो सकती है, लेकिन यह आम तौर पर कई हफ्तों से लेकर कई महीनों तक रहती है, जो एक अपट्रेंड के संदर्भ में समेकन या बग़ल में आंदोलन की अवधि का प्रतिनिधित्व करती है।
- वॉल्यूम विश्लेषण: तेजी के आयत पैटर्न की वैधता की पुष्टि करने के लिए वॉल्यूम विश्लेषण आवश्यक है। समेकन चरण के दौरान, वॉल्यूम में कमी आती है, जो महत्वपूर्ण बिक्री दबाव की कमी का संकेत देता है। हालाँकि, जब कीमत पैटर्न से बाहर हो जाती है, तो वॉल्यूम आदर्श रूप से बढ़ना चाहिए, जो तेजी की निरंतरता की पुष्टि करता है।
- ब्रेकआउट: तेजी के आयत पैटर्न की पुष्टि तब होती है जब कीमत ऊपरी ट्रेंडलाइन के ऊपर टूट जाती है, जो अपट्रेंड की निरंतरता का संकेत देती है। व्यापारी अक्सर ब्रेकआउट की पुष्टि के लिए बढ़ी हुई मात्रा के साथ ऊपरी ट्रेंडलाइन के ऊपर एक निर्णायक समापन की तलाश करते हैं।
- मूल्य लक्ष्य: एक तेजी से आयत पैटर्न के लिए मूल्य लक्ष्य को अक्सर ब्रेकआउट बिंदु पर आयत की ऊंचाई (समर्थन और प्रतिरोध स्तरों के बीच की दूरी) जोड़कर मापा जाता है। इससे व्यापारियों को यह अनुमान मिलता है कि ब्रेकआउट के बाद कीमत कितनी दूर तक बढ़ सकती है।
- गलत ब्रेकआउट: गलत ब्रेकआउट हो सकता है, जहां कीमत थोड़ी देर के लिए ऊपरी ट्रेंडलाइन से ऊपर चली जाती है लेकिन फिर पैटर्न में वापस आ जाती है। व्यापारियों को कार्रवाई करने से पहले पुष्टि की प्रतीक्षा करनी चाहिए, यह सुनिश्चित करते हुए कि ब्रेकआउट को मजबूत मात्रा और मूल्य गति द्वारा समर्थित किया गया है।
- पैटर्न की विफलता: कुछ मामलों में, तेजी का आयत पैटर्न अपेक्षित तेजी की निरंतरता पैदा करने में विफल हो सकता है। यदि कीमत ऊपरी ट्रेंडलाइन के बजाय निचली ट्रेंडलाइन से नीचे गिरती है, तो यह एक विफल पैटर्न का संकेत दे सकता है। यह संभावित प्रवृत्ति के उलट होने या समेकन की लंबी अवधि का संकेत दे सकता है।
किसी भी तकनीकी विश्लेषण पैटर्न की तरह, सफल ट्रेडों की संभावना बढ़ाने के लिए अन्य विश्लेषण उपकरणों और संकेतकों के साथ तेजी से आयत पैटर्न का उपयोग करना महत्वपूर्ण है।


