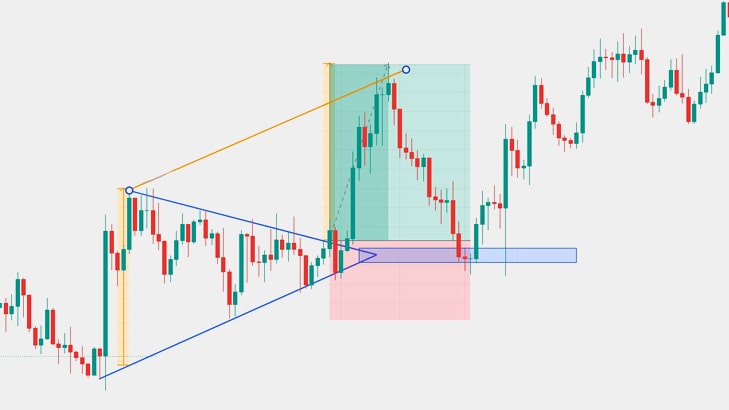
The bullish symmetrical triangle chart pattern is a technical analysis pattern that typically forms within financial markets, signaling a potential continuation of an existing uptrend. Here’s how it’s characterized:
Triangle Formation: The pattern consists of two converging trendlines, one representing the upper resistance line and the other representing the lower support line. These trendlines converge to form a symmetrical triangle pattern.
Higher Lows: The lower trendline connects a series of higher lows, indicating that buyers are willing to buy at progressively higher prices.
Lower Highs: The upper trendline connects a series of lower highs, suggesting that sellers are stepping in to sell at lower prices.
Convergence: As the price approaches the apex of the triangle, the distance between the support and resistance lines decreases, indicating a contraction in price volatility.
Volume: Volume tends to diminish as the pattern progresses, reflecting the uncertainty and indecision among market participants.
Breakout: The pattern is considered complete when the price breaks out above the upper resistance line, typically accompanied by a surge in volume. This breakout confirms the bullish bias and signals a potential continuation of the uptrend.
Trading the bullish symmetrical triangle pattern often involves entering a long (buy) position once the breakout occurs, with a stop-loss order placed below the lower trendline to manage risk. Traders may also use other technical indicators or chart patterns to confirm the validity of the breakout and to identify potential price targets.
As with any technical analysis pattern, it’s essential to consider other factors such as market conditions, fundamental analysis, and risk management principles before making trading decisions solely based on the bullish symmetrical triangle pattern.

तेजी सममित त्रिकोण चार्ट पैटर्न एक तकनीकी विश्लेषण पैटर्न है जो आम तौर पर वित्तीय बाजारों के भीतर बनता है, जो मौजूदा अपट्रेंड की संभावित निरंतरता का संकेत देता है। इसकी विशेषता इस प्रकार है:
- त्रिभुज निर्माण: पैटर्न में दो अभिसरण प्रवृत्ति रेखाएं होती हैं, एक ऊपरी प्रतिरोध रेखा का प्रतिनिधित्व करती है और दूसरी निचली समर्थन रेखा का प्रतिनिधित्व करती है। ये ट्रेंडलाइन एक सममित त्रिकोण पैटर्न बनाने के लिए एकत्रित होती हैं।
- उच्चतर निम्न: निचली प्रवृत्ति रेखा उच्चतर निम्न की एक श्रृंखला को जोड़ती है, जो दर्शाती है कि खरीदार उत्तरोत्तर उच्च कीमतों पर खरीदारी करने के इच्छुक हैं।
- निचली ऊँचाई: ऊपरी ट्रेंडलाइन निचली ऊँचाइयों की एक श्रृंखला को जोड़ती है, यह सुझाव देती है कि विक्रेता कम कीमतों पर बेचने के लिए कदम उठा रहे हैं।
- अभिसरण: जैसे-जैसे कीमत त्रिकोण के शीर्ष पर पहुंचती है, समर्थन और प्रतिरोध रेखाओं के बीच की दूरी कम हो जाती है, जो मूल्य अस्थिरता में संकुचन का संकेत देती है।
- वॉल्यूम: जैसे-जैसे पैटर्न आगे बढ़ता है वॉल्यूम कम होता जाता है, जो बाजार सहभागियों के बीच अनिश्चितता और अनिर्णय को दर्शाता है।
- ब्रेकआउट: पैटर्न को तब पूर्ण माना जाता है जब कीमत ऊपरी प्रतिरोध रेखा से ऊपर निकल जाती है, आमतौर पर वॉल्यूम में वृद्धि के साथ। यह ब्रेकआउट तेजी के पूर्वाग्रह की पुष्टि करता है और अपट्रेंड के संभावित जारी रहने का संकेत देता है।
तेजी के सममित त्रिकोण पैटर्न में व्यापार करने में अक्सर ब्रेकआउट होने के बाद लंबी (खरीद) स्थिति में प्रवेश करना शामिल होता है, जिसमें जोखिम को प्रबंधित करने के लिए निचली ट्रेंडलाइन के नीचे स्टॉप-लॉस ऑर्डर रखा जाता है। ब्रेकआउट की वैधता की पुष्टि करने और संभावित मूल्य लक्ष्य की पहचान करने के लिए व्यापारी अन्य तकनीकी संकेतक या चार्ट पैटर्न का भी उपयोग कर सकते हैं।
किसी भी तकनीकी विश्लेषण पैटर्न की तरह, केवल तेजी सममित त्रिकोण पैटर्न के आधार पर व्यापारिक निर्णय लेने से पहले बाजार की स्थितियों, मौलिक विश्लेषण और जोखिम प्रबंधन सिद्धांतों जैसे अन्य कारकों पर विचार करना आवश्यक है।


