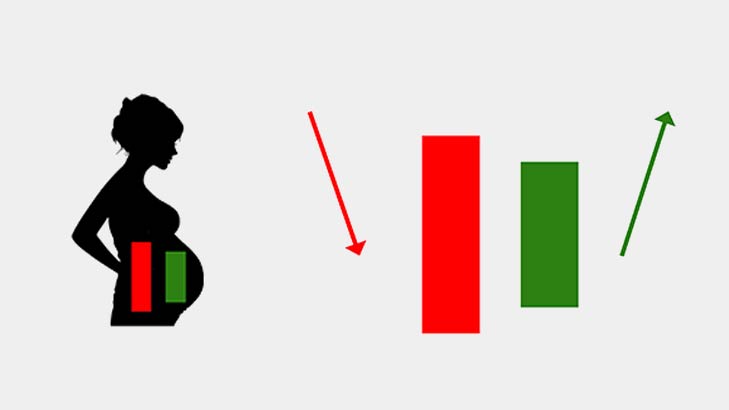
Candlestick
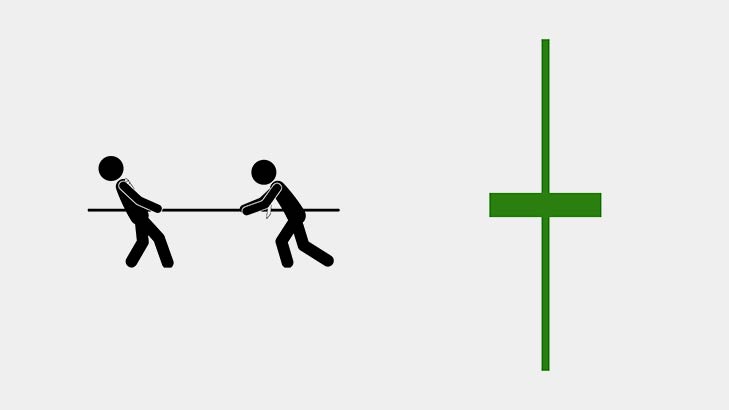
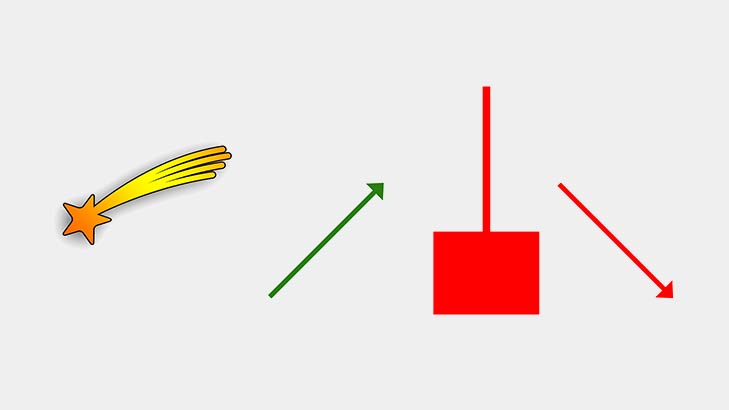
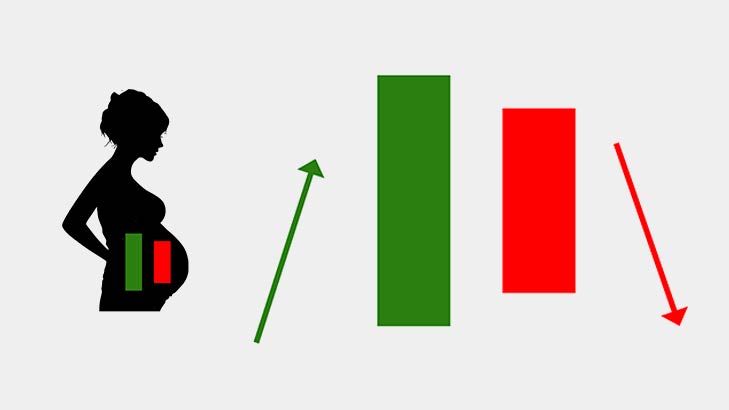
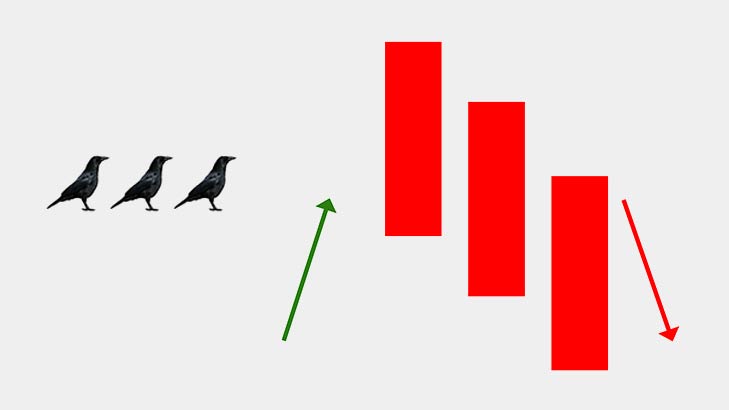
A candlestick is a tool used in technical analysis to represent price movements of an asset, such as stocks, currencies, or commodities, over a specific period of time. Each candlestick typically displays four key pieces of information: the opening price, the closing price, the highest price, and the lowest price within the given time frame. The body of the candlestick represents the price range between the opening and closing prices, while the wicks (or shadows) indicate the highest and lowest prices reached during the time period. Candlestick charts are widely used by traders and analysts to identify trends, patterns, and potential price reversals in financial markets.
