The “double bottom” pattern is another common technical analysis pattern observed in financial markets, particularly in the stock market. It typically occurs after a downtrend and is considered a bullish reversal pattern. Here’s how it works:
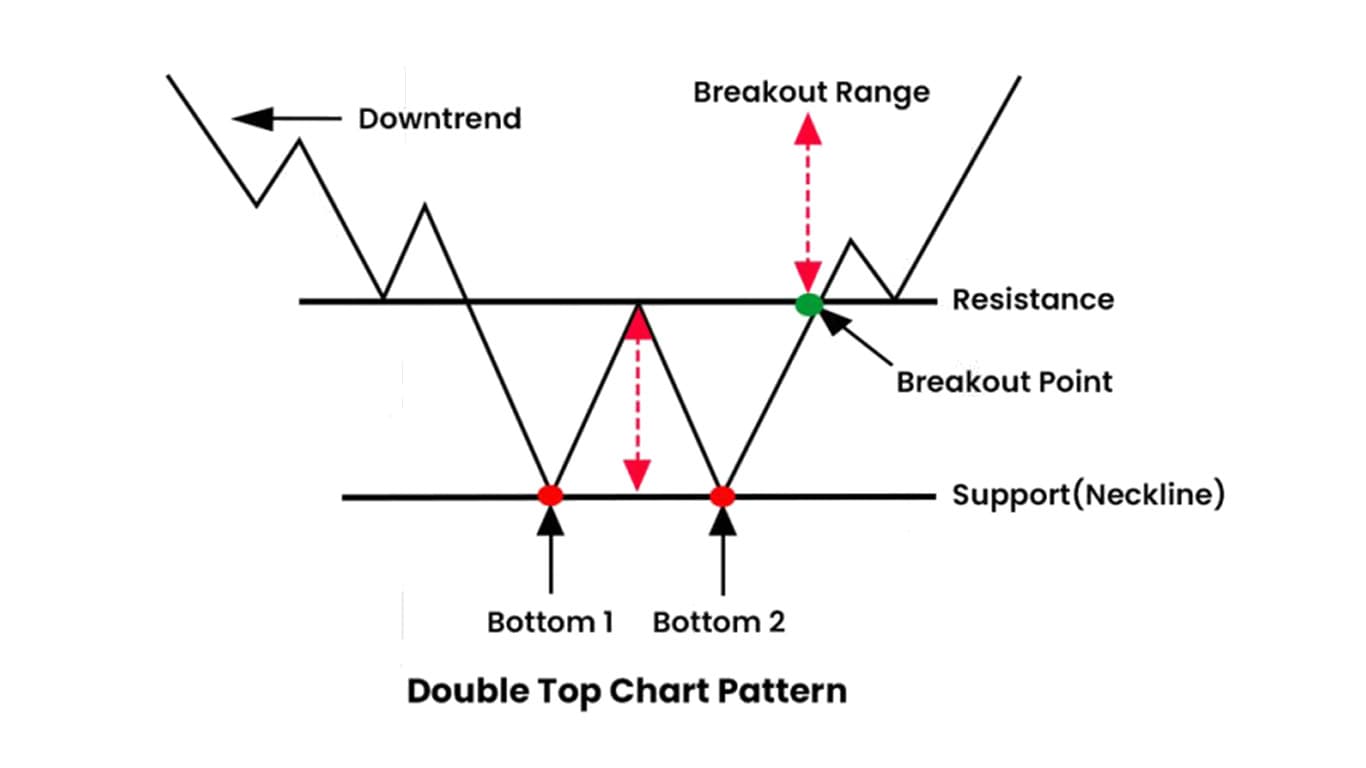
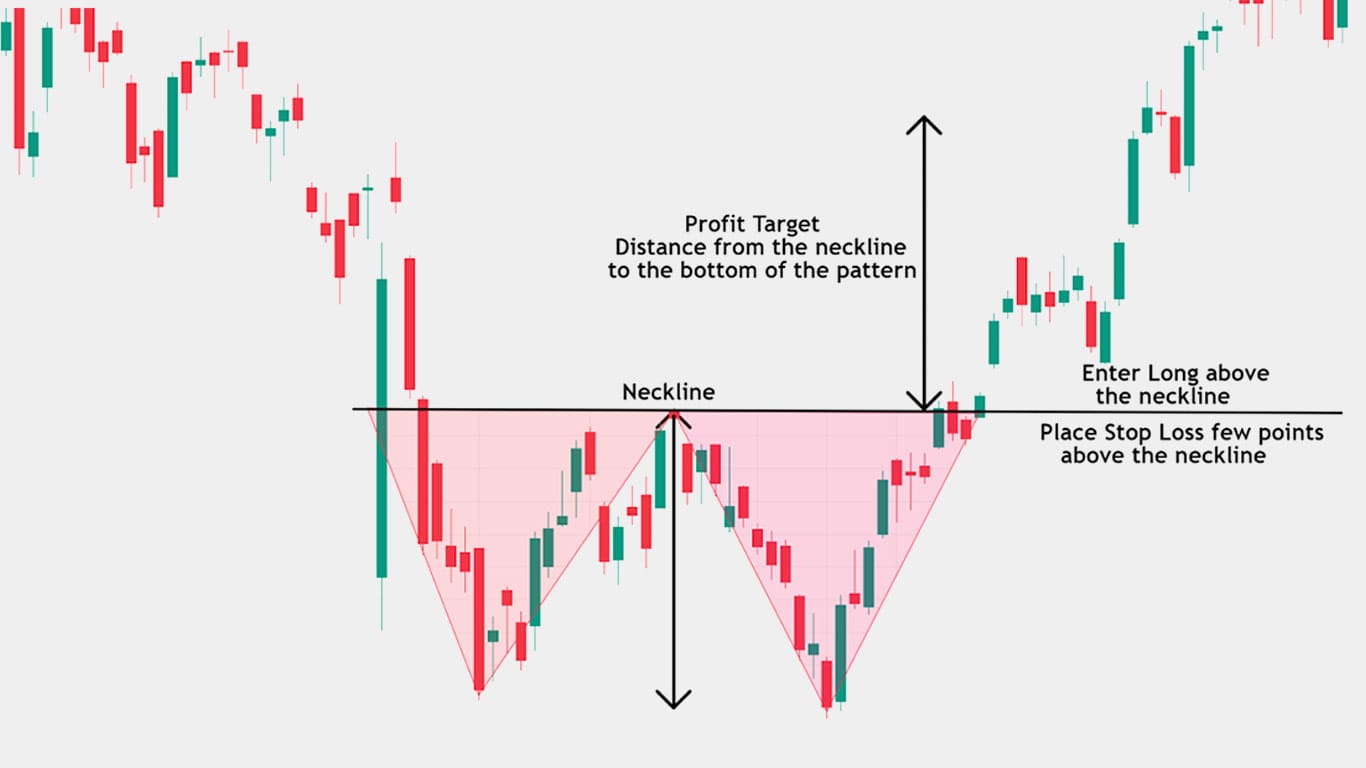
Formation: The double bottom pattern forms when the price of an asset reaches a low point, then bounces up, retraces back down to a similar low (the “bottom”), and then bounces up again.
Confirmation: Traders look for confirmation of the pattern by observing a significant price increase after the second bottom is formed. This increase usually indicates that the selling pressure that sustained the downtrend has weakened, and buyers are gaining control.
Neckline: Similar to the double top pattern, the neckline of the double bottom pattern is formed by connecting the highs of the retracement between the two bottoms. It acts as a resistance level. When the price breaks above this neckline after the second bottom, it confirms the pattern.
Price Target: The price target for a double bottom pattern is often estimated by measuring the distance from the neckline to the bottoms and projecting that upward from the neckline. This gives an approximate target for how far the price may rise after the pattern is confirmed.
As with any trading pattern, it’s essential to consider other factors such as volume, market context, and fundamental analysis when making trading decisions based on the double bottom pattern. While it is considered a bullish reversal pattern, not all instances of a double bottom will lead to significant price increases, so traders often use additional indicators or confirmations to validate their trading decisions.

“डबल बॉटम” पैटर्न वित्तीय बाजारों में देखा जाने वाला एक और सामान्य तकनीकी विश्लेषण पैटर्न है, खासकर शेयर बाजार में। यह आमतौर पर डाउनट्रेंड के बाद होता है और इसे एक तेजी से उलट पैटर्न माना जाता है। यह ऐसे काम करता है:
- गठन: डबल बॉटम पैटर्न तब बनता है जब किसी परिसंपत्ति की कीमत निम्न बिंदु पर पहुंचती है, फिर ऊपर उछलती है, वापस समान निम्न (“नीचे”) पर वापस आ जाती है, और फिर फिर से उछल जाती है।
- पुष्टि: व्यापारी दूसरा तल बनने के बाद महत्वपूर्ण मूल्य वृद्धि देखकर पैटर्न की पुष्टि की तलाश करते हैं। यह वृद्धि आम तौर पर इंगित करती है कि गिरावट का रुख बनाए रखने वाला बिक्री दबाव कमजोर हो गया है, और खरीदार नियंत्रण हासिल कर रहे हैं।
- नेकलाइन: डबल टॉप पैटर्न के समान, डबल बॉटम पैटर्न की नेकलाइन दो बॉटम के बीच रिट्रेसमेंट की ऊंचाई को जोड़कर बनाई जाती है। यह प्रतिरोध स्तर के रूप में कार्य करता है। जब कीमत दूसरे तल के बाद इस नेकलाइन से ऊपर टूटती है, तो यह पैटर्न की पुष्टि करती है।
- मूल्य लक्ष्य: डबल बॉटम पैटर्न के लिए मूल्य लक्ष्य का अनुमान अक्सर नेकलाइन से बॉटम तक की दूरी को मापकर और नेकलाइन से ऊपर की ओर प्रक्षेपित करके लगाया जाता है। यह एक अनुमानित लक्ष्य देता है कि पैटर्न की पुष्टि होने के बाद कीमत कितनी बढ़ सकती है।
किसी भी ट्रेडिंग पैटर्न की तरह, डबल बॉटम पैटर्न के आधार पर ट्रेडिंग निर्णय लेते समय वॉल्यूम, बाजार संदर्भ और मौलिक विश्लेषण जैसे अन्य कारकों पर विचार करना आवश्यक है। हालांकि इसे एक तेजी से उलट पैटर्न माना जाता है, लेकिन डबल बॉटम के सभी उदाहरणों से महत्वपूर्ण मूल्य वृद्धि नहीं होगी, इसलिए व्यापारी अक्सर अपने व्यापारिक निर्णयों को मान्य करने के लिए अतिरिक्त संकेतक या पुष्टिकरण का उपयोग करते हैं।


