A hammer candlestick is a single-candle pattern often seen in technical analysis of financial markets, which indicates a potential reversal in the direction of the asset’s price. Here’s a detailed explanation of its characteristics and implications:
Characteristics of a Hammer Candlestick
Shape and Appearance:
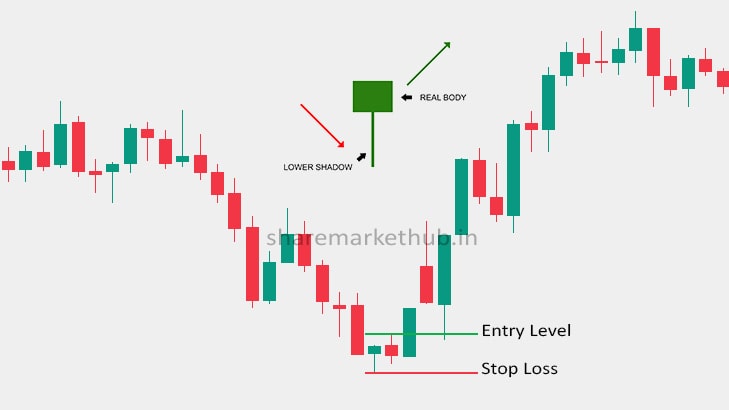
- Long Lower Shadow: The lower shadow (or wick) is at least twice the length of the real body. This indicates that during the trading period, the price dropped significantly but recovered to close near or above the opening price.
- Small Real Body: The real body (the area between the opening and closing prices) is small, located near the top of the candlestick. The color of the body can be either green (bullish) or red (bearish), but a green hammer is generally seen as more bullish.
- Little or No Upper Shadow: The absence of an upper shadow, or a very short one, implies that the closing price was near the high of the period.
Location:
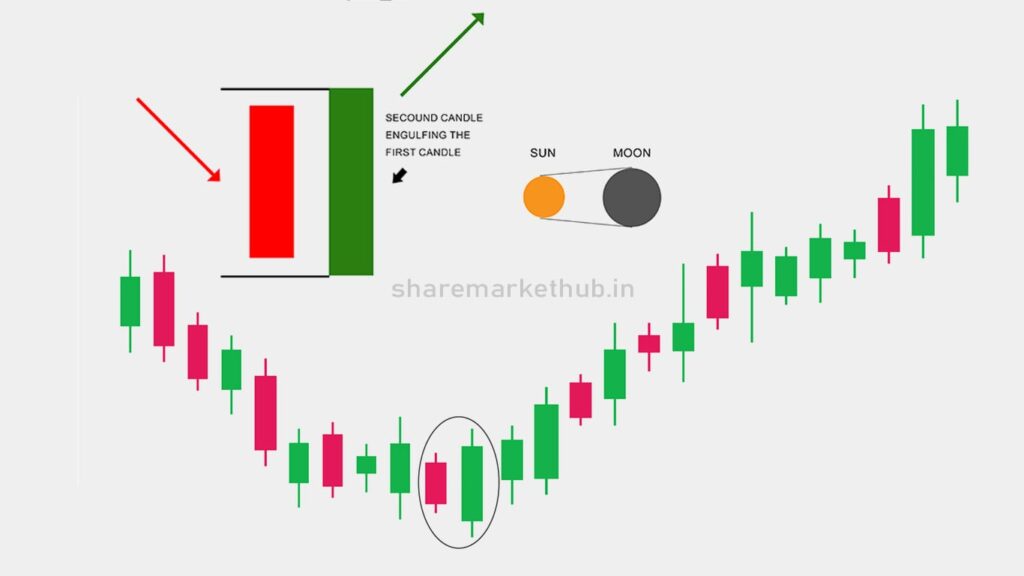
- Downtrend Context: A hammer candlestick is most significant when it appears after a downtrend, as it suggests a potential bullish reversal. The price action implies that sellers pushed the price down, but buyers stepped in and drove the price back up towards the close.

Interpretation and Implications
Reversal Signal:
- The hammer candlestick signals a potential reversal from a downtrend to an uptrend. It suggests that although sellers were able to drive prices lower, buying interest emerged, pushing the price back up, which can be a precursor to an upward movement.
Confirmation:
- To increase the reliability of the reversal signal, traders often look for confirmation in the subsequent candles. A common confirmation is a bullish candle that closes above the hammer’s closing price. This follow-up buying pressure reinforces the likelihood of a trend reversal.
Trading Strategy
Entry Point:
- Traders might consider entering a long position once the price moves above the high of the hammer candlestick, indicating that the buying pressure is continuing.
Stop Loss:
- A logical place to set a stop loss is below the low of the hammer’s shadow. This protects against the risk of the downtrend continuing despite the hammer pattern.
Profit Targets:
- Traders may set profit targets based on previous resistance levels, Fibonacci retracement levels, or other technical indicators.
Example
Imagine a stock in a downtrend where the price opens at $50, drops to a low of $45, but then rallies to close at $49. This forms a hammer candlestick with a small real body near the high and a long lower shadow. The next day, if the price moves above $49, it can be seen as confirmation of the bullish reversal signaled by the hammer.
Key Points to Remember
- Context Matters: The hammer is only significant in the context of a downtrend.
- Confirmation: Waiting for confirmation helps filter out false signals.
- Risk Management: Always use appropriate stop losses to manage risk.
In summary, the hammer candlestick is a useful pattern in technical analysis for identifying potential reversal points in a downtrend, but it should be used in conjunction with other technical indicators and strategies for best results.
हैमर कैंडलस्टिक एक सिंगल-कैंडल पैटर्न है जिसे अक्सर वित्तीय बाजारों के तकनीकी विश्लेषण में देखा जाता है, जो परिसंपत्ति की कीमत की दिशा में संभावित उलटफेर को इंगित करता है। यहाँ इसकी विशेषताओं और निहितार्थों का विस्तृत विवरण दिया गया है:
हैमर कैंडलस्टिक की विशेषताएँ
1. आकार और दिखावट
लंबी निचली छाया: निचली छाया (या बाती) वास्तविक बॉडी की लंबाई से कम से कम दोगुनी होती है। यह दर्शाता है कि ट्रेडिंग अवधि के दौरान, कीमत में काफी गिरावट आई लेकिन शुरुआती कीमत के करीब या उससे ऊपर बंद होने के लिए ठीक हो गई।
छोटी वास्तविक बॉडी: वास्तविक बॉडी (शुरुआती और समापन कीमतों के बीच का क्षेत्र) छोटी होती है, जो कैंडलस्टिक के शीर्ष के पास स्थित होती है। बॉडी का रंग हरा (तेजी) या लाल (मंदी) हो सकता है, लेकिन हरे रंग के हैमर को आम तौर पर अधिक तेजी के रूप में देखा जाता है।
थोड़ी या कोई ऊपरी छाया नहीं: ऊपरी छाया की अनुपस्थिति, या बहुत छोटी, इसका मतलब है कि समापन मूल्य अवधि के उच्च के पास था।
2. स्थान:
डाउनट्रेंड संदर्भ: हैमर कैंडलस्टिक सबसे महत्वपूर्ण तब होता है जब यह डाउनट्रेंड के बाद दिखाई देता है, क्योंकि यह संभावित तेजी के उलटफेर का संकेत देता है। मूल्य क्रिया का तात्पर्य है कि विक्रेताओं ने मूल्य को नीचे धकेल दिया, लेकिन खरीदारों ने कदम बढ़ाया और मूल्य को बंद होने की ओर वापस ऊपर ले गए।
व्याख्या और निहितार्थ
1. उलटफेर संकेत:
हैमर कैंडलस्टिक डाउनट्रेंड से अपट्रेंड में संभावित उलटफेर का संकेत देता है। यह सुझाव देता है कि हालांकि विक्रेता कीमतों को कम करने में सक्षम थे, लेकिन खरीददारी की रुचि उभरी, जिससे मूल्य वापस ऊपर चला गया, जो ऊपर की ओर बढ़ने का अग्रदूत हो सकता है।
2. पुष्टि:
उलटफेर संकेत की विश्वसनीयता बढ़ाने के लिए, व्यापारी अक्सर बाद की मोमबत्तियों में पुष्टि की तलाश करते हैं। एक सामान्य पुष्टि एक तेजी वाली मोमबत्ती है जो हैमर के समापन मूल्य से ऊपर बंद होती है। यह अनुवर्ती खरीद दबाव एक प्रवृत्ति उलटफेर की संभावना को मजबूत करता है।
ट्रेडिंग रणनीति
1. प्रवेश बिंदु:
व्यापारी एक बार जब मूल्य हैमर कैंडलस्टिक के उच्च से ऊपर चला जाता है, तो एक लंबी स्थिति में प्रवेश करने पर विचार कर सकते हैं, यह दर्शाता है कि खरीद दबाव जारी है।
2. स्टॉप लॉस:
स्टॉप लॉस सेट करने के लिए एक तार्किक स्थान हैमर की छाया के निचले स्तर से नीचे है। यह हैमर पैटर्न के बावजूद डाउनट्रेंड के जारी रहने के जोखिम से बचाता है।
3. लाभ लक्ष्य:
ट्रेडर पिछले प्रतिरोध स्तरों, फिबोनाची रिट्रेसमेंट स्तरों या अन्य तकनीकी संकेतकों के आधार पर लाभ लक्ष्य निर्धारित कर सकते हैं।
उदाहरण
एक स्टॉक की कल्पना करें जो डाउनट्रेंड में है, जहाँ कीमत $50 पर खुलती है, $45 के निचले स्तर पर गिरती है, लेकिन फिर $49 पर बंद होने के लिए बढ़ जाती है। यह उच्च के पास एक छोटे से वास्तविक शरीर और एक लंबी निचली छाया के साथ एक हैमर कैंडलस्टिक बनाता है। अगले दिन, यदि कीमत $49 से ऊपर जाती है, तो इसे हैमर द्वारा संकेतित तेजी के उलटफेर की पुष्टि के रूप में देखा जा सकता है।
याद रखने योग्य मुख्य बिंदु
संदर्भ मायने रखता है: हैमर केवल डाउनट्रेंड के संदर्भ में महत्वपूर्ण है।
पुष्टि: पुष्टि की प्रतीक्षा करने से झूठे संकेतों को फ़िल्टर करने में मदद मिलती है।
जोखिम प्रबंधन: जोखिम को प्रबंधित करने के लिए हमेशा उचित स्टॉप लॉस का उपयोग करें।
संक्षेप में, हैमर कैंडलस्टिक तकनीकी विश्लेषण में डाउनट्रेंड में संभावित उलट बिंदुओं की पहचान करने के लिए एक उपयोगी पैटर्न है, लेकिन सर्वोत्तम परिणामों के लिए इसका उपयोग अन्य तकनीकी संकेतकों और रणनीतियों के साथ किया जाना चाहिए।