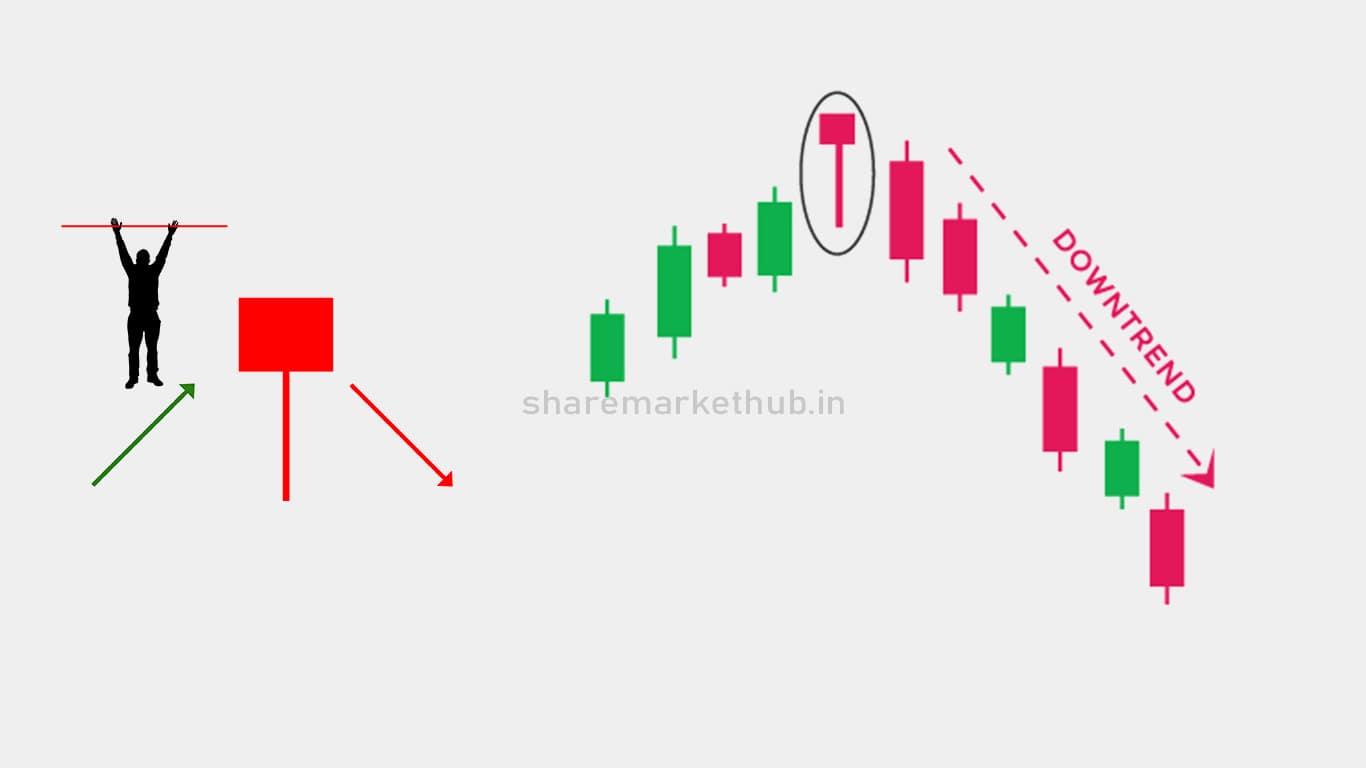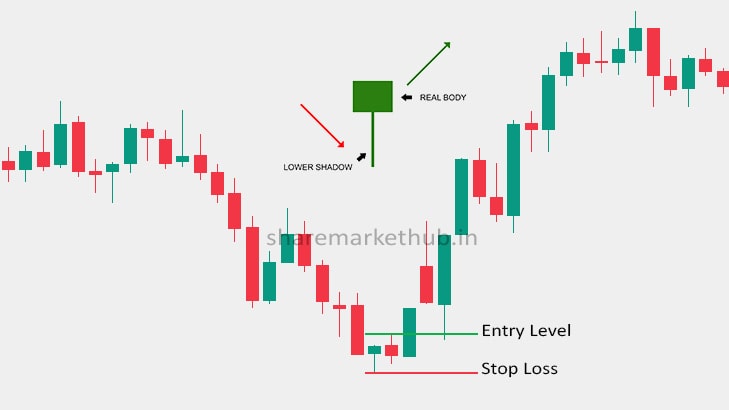
A Hanging Man candlestick pattern is a single candle formation that technical analysts use to identify potential reversals in an uptrend. This pattern suggests that a recent uptrend could be coming to an end, and a downtrend might be on the horizon. Here are the key features and implications of the Hanging Man candlestick pattern:
Characteristics of a Hanging Man Candlestick
Small Real Body: The candle has a small real body, which can be either bullish (white or green) or bearish (black or red). The color of the body is not as important as its size and position.
Long Lower Shadow: The lower shadow should be at least twice the length of the real body. This long shadow indicates that during the session, the price fell significantly but then recovered to close near the opening price.
Little or No Upper Shadow: There should be little or no upper shadow. This shows that the price did not move much above the opening price during the session.
Position: The Hanging Man pattern occurs after a significant uptrend. Its presence near the top of the uptrend is a key aspect.
Psychological Interpretation
- Buying Pressure: During the session, there was significant selling pressure that pushed the price down. However, buyers managed to push the price back up near the opening level.
- Potential Weakness: Despite the recovery, the appearance of the long lower shadow shows potential weakness in the current uptrend. It indicates that sellers are starting to dominate.
- Caution: Traders should be cautious and look for confirmation in the following sessions before making decisions based solely on the Hanging Man pattern.
Confirmation
The Hanging Man pattern by itself is not a definitive signal to sell or short a stock. Confirmation is essential. Confirmation might come in the form of:
- A subsequent bearish candlestick that closes below the real body of the Hanging Man.
- Increased trading volume on the day of the Hanging Man, indicating stronger selling pressure.
- Other technical indicators supporting the potential reversal, such as overbought conditions or negative divergences in momentum indicators (e.g., RSI, MACD).
Example
Imagine a stock that has been rising for several weeks. One day, the stock opens at $50, drops to $45 during the session, but recovers to close at $49. This session creates a Hanging Man candlestick. Traders would watch the next few sessions closely. If the stock opens lower or continues to decline, this would confirm the bearish implications of the Hanging Man pattern.
Usage in Trading
- Risk Management: Traders often use the Hanging Man pattern as a signal to tighten stop-loss orders or take profits on long positions.
- Short Selling: Some aggressive traders may consider opening short positions if they receive confirmation of the bearish reversal.
Limitations
- False Signals: Like all technical patterns, the Hanging Man can sometimes give false signals. It’s important to use it in conjunction with other technical analysis tools.
- Market Conditions: The effectiveness of the Hanging Man pattern can vary depending on overall market conditions and the specific asset being traded.
In summary, the Hanging Man candlestick pattern is a useful tool for traders to identify potential reversals in uptrends. However, it should be used with caution and confirmed with other technical indicators or patterns to improve accuracy.


