A Piercing Pattern is a bullish candlestick pattern used in technical analysis to signal a potential reversal from a downtrend to an uptrend. It is considered a reliable indicator of a bullish reversal, especially when it appears after a sustained decline in prices. Here’s a breakdown of its key features and how it is interpreted:
Key Features of a Piercing Pattern
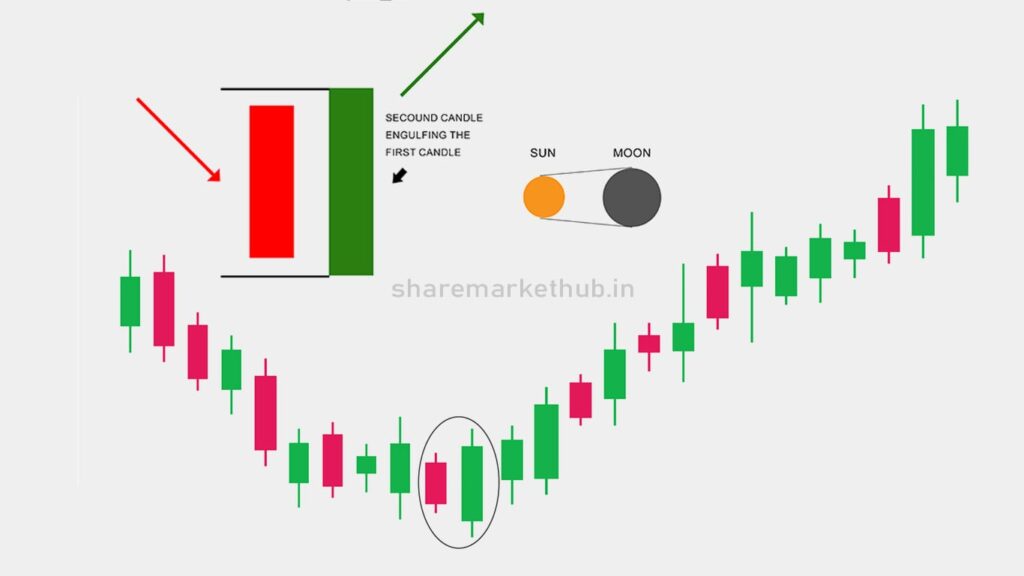
Two Candlesticks: The pattern consists of two candles.
- The first candle is bearish, typically a long red or black candle, indicating a strong downtrend.
- The second candle is bullish, typically a long green or white candle, indicating a reversal.
Positioning:
- The bearish candle closes near its low.
- The bullish candle opens below the low of the bearish candle and closes above the midpoint of the bearish candle’s body.
Volume: Increased volume on the second candle can add confirmation to the pattern.
Interpretation and Significance
Bullish Reversal: The Piercing Pattern suggests that the bears (sellers) are losing control and the bulls (buyers) are starting to gain momentum. The strong opening gap down, followed by a rally that closes above the midpoint of the previous candle, indicates a shift in sentiment.
Confirmation: For stronger validation, traders look for confirmation in subsequent candles, such as another bullish candle or an increase in trading volume.

Example
Consider a stock in a downtrend with the following candlestick behavior:
- Day 1: The stock opens at $100, drops, and closes at $90, forming a bearish candle.
- Day 2: The stock opens at $85 (below the previous day’s close), but buyers push the price up to close at $95, which is above the midpoint of the previous day’s body.
This pattern forms a Piercing Pattern and suggests a potential bullish reversal.
Trading Strategy
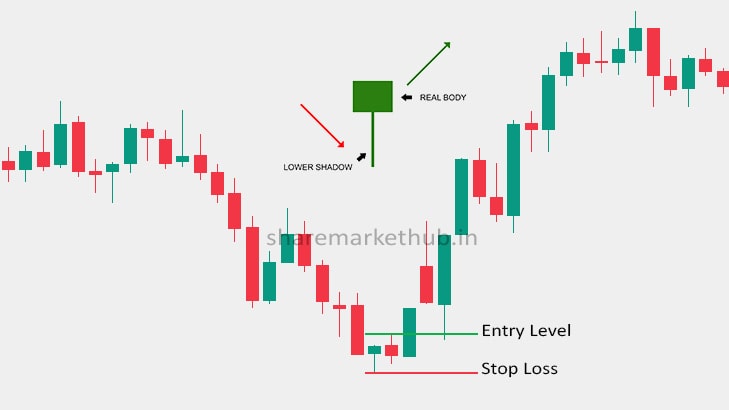
- Entry Point: Traders might enter a long position at the opening of the next candle following the Piercing Pattern, particularly if it opens higher than the close of the bullish candle.
- Stop Loss: A common strategy is to place a stop loss below the low of the bullish candle to limit potential losses.
- Target: The target price can be set based on key resistance levels, Fibonacci retracement levels, or a fixed risk-reward ratio.
Conclusion
The Piercing Pattern is a useful tool for traders and analysts to identify potential bullish reversals. However, it should be used in conjunction with other technical analysis tools and indicators to increase the probability of successful trades. As with any trading strategy, risk management is crucial to mitigate potential losses.
पियर्सिंग पैटर्न एक बुलिश कैंडलस्टिक पैटर्न है जिसका उपयोग तकनीकी विश्लेषण में डाउनट्रेंड से अपट्रेंड में संभावित उलटफेर का संकेत देने के लिए किया जाता है। इसे बुलिश रिवर्सल का एक विश्वसनीय संकेतक माना जाता है, खासकर जब यह कीमतों में लगातार गिरावट के बाद दिखाई देता है। यहाँ इसकी प्रमुख विशेषताओं का विवरण दिया गया है और इसे कैसे समझा जाता है:
पियर्सिंग पैटर्न की प्रमुख विशेषताएँ
1. दो कैंडलस्टिक्स: पैटर्न में दो कैंडल होती हैं।
- पहली कैंडल बियरिश होती है, आमतौर पर एक लंबी लाल या काली कैंडल होती है, जो एक मजबूत डाउनट्रेंड को दर्शाती है।
- दूसरी कैंडल बुलिश होती है, आमतौर पर एक लंबी हरी या सफेद कैंडल होती है, जो एक उलटफेर को दर्शाती है।
2. पोजिशनिंग:
- बियरिश कैंडल अपने निचले स्तर के पास बंद होती है।
- बुलिश कैंडल बियरिश कैंडल के निचले स्तर से नीचे खुलती है और बियरिश कैंडल के शरीर के मध्य बिंदु से ऊपर बंद होती है।
3. वॉल्यूम: दूसरी कैंडल पर बढ़ा हुआ वॉल्यूम पैटर्न में पुष्टि जोड़ सकता है।
व्याख्या और महत्व
- बुलिश रिवर्सल: पियर्सिंग पैटर्न से पता चलता है कि भालू (विक्रेता) नियंत्रण खो रहे हैं और बैल (खरीदार) गति प्राप्त करना शुरू कर रहे हैं। मजबूत ओपनिंग गैप डाउन, उसके बाद एक रैली जो पिछली मोमबत्ती के मध्य बिंदु से ऊपर बंद होती है, भावना में बदलाव का संकेत देती है।
- पुष्टि: मजबूत सत्यापन के लिए, व्यापारी बाद की मोमबत्तियों में पुष्टि की तलाश करते हैं, जैसे कि एक और तेजी वाली मोमबत्ती या ट्रेडिंग वॉल्यूम में वृद्धि।
उदाहरण
निम्नलिखित कैंडलस्टिक व्यवहार के साथ डाउनट्रेंड में एक स्टॉक पर विचार करें:
1. दिन 1: स्टॉक $100 पर खुलता है, गिरता है, और $90 पर बंद होता है, जिससे एक मंदी वाली कैंडल बनती है।
2. दिन 2: स्टॉक $85 (पिछले दिन के बंद से नीचे) पर खुलता है, लेकिन खरीदार कीमत को $95 पर बंद करने के लिए बढ़ाते हैं, जो पिछले दिन के बॉडी के मध्य बिंदु से ऊपर है।
यह पैटर्न एक पियर्सिंग पैटर्न बनाता है और संभावित तेजी से उलटफेर का सुझाव देता है।
ट्रेडिंग रणनीति
• प्रवेश बिंदु: व्यापारी पियर्सिंग पैटर्न के बाद अगली कैंडल के खुलने पर एक लंबी स्थिति में प्रवेश कर सकते हैं, खासकर अगर यह तेजी वाली कैंडल के बंद होने से अधिक खुलता है।
• स्टॉप लॉस: संभावित नुकसान को सीमित करने के लिए तेजी वाली कैंडल के निचले स्तर से नीचे स्टॉप लॉस लगाना एक आम रणनीति है।
• लक्ष्य: लक्ष्य मूल्य को प्रमुख प्रतिरोध स्तरों, फिबोनाची रिट्रेसमेंट स्तरों या एक निश्चित जोखिम-इनाम अनुपात के आधार पर सेट किया जा सकता है।
निष्कर्ष
पियर्सिंग पैटर्न व्यापारियों और विश्लेषकों के लिए संभावित तेजी के उलटफेर की पहचान करने के लिए एक उपयोगी उपकरण है। हालाँकि, सफल ट्रेडों की संभावना बढ़ाने के लिए इसका उपयोग अन्य तकनीकी विश्लेषण उपकरणों और संकेतकों के साथ किया जाना चाहिए। किसी भी ट्रेडिंग रणनीति की तरह, संभावित नुकसान को कम करने के लिए जोखिम प्रबंधन महत्वपूर्ण है।