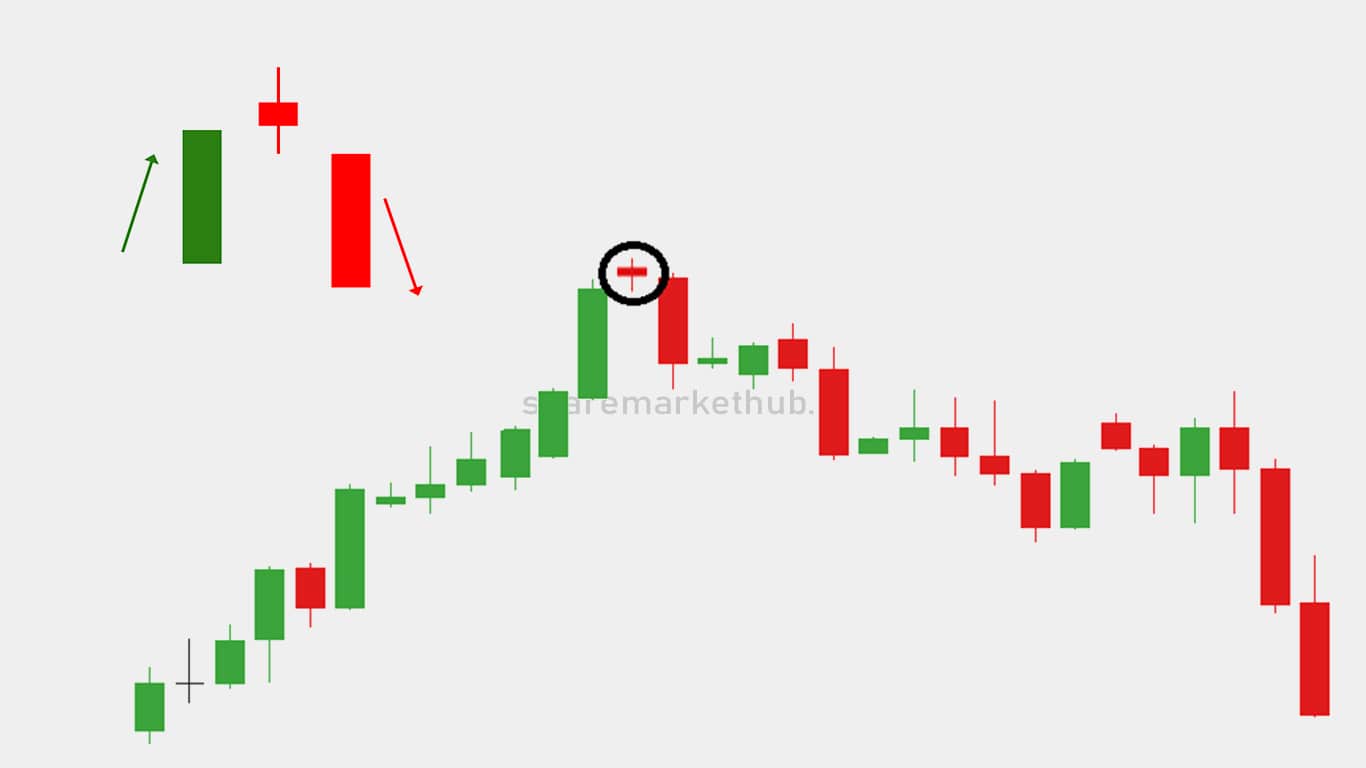
The Evening Star candlestick pattern is a three-candle formation that technical analysts use to identify potential reversals from an uptrend to a downtrend. This pattern is considered a strong indicator of bearish reversal when it appears at the top of an uptrend. Here are the key features and implications of the Evening Star pattern:
Characteristics of an Evening Star Candlestick Pattern
First Candle: The first candle is a large bullish (white or green) candlestick that continues the current uptrend, showing strong buying pressure.
Second Candle: The second candle is a small-bodied candlestick (it can be bullish, bearish, or a doji) that gaps up from the first candle. This candle reflects indecision in the market, with the bulls starting to lose momentum.
Third Candle: The third candle is a large bearish (black or red) candlestick that closes well into the body of the first candle, indicating that the bears have taken control and a reversal is likely underway.
Psychological Interpretation
- First Candle (Strength): The strong bullish candle indicates the continuation of the uptrend, with buyers in control.
- Second Candle (Indecision): The small-bodied candle or doji that gaps up suggests indecision and a potential loss of momentum among buyers.
- Third Candle (Reversal): The strong bearish candle closing well into the body of the first candle signals that sellers have overpowered the buyers, suggesting a bearish reversal.
Confirmation
For a stronger signal, traders look for confirmation of the Evening Star pattern, such as:
- A subsequent bearish candlestick that continues to move lower, confirming the reversal.
- Increased trading volume on the third day, indicating strong selling pressure.
- Other technical indicators supporting the bearish reversal, such as overbought conditions, negative divergences in momentum indicators (e.g., RSI, MACD), or key resistance levels.
Example
Consider a stock in an uptrend that forms an Evening Star pattern:
- First Day: The stock opens at $50 and closes at $55, forming a large bullish candle.
- Second Day: The stock opens at $56, trades within a narrow range, and closes at $57, forming a small-bodied candle or doji.
- Third Day: The stock opens at $56, drops significantly, and closes at $51, forming a large bearish candle that closes well into the body of the first candle.
Usage in Trading
- Risk Management: Traders might use the Evening Star pattern as a signal to tighten stop-loss orders or take profits on long positions.
- Opening Short Positions: Some traders might consider opening short positions if they receive confirmation of the bearish reversal, anticipating further declines in price.
Limitations
- False Signals: As with any technical pattern, the Evening Star can sometimes give false signals. It is important to use it in conjunction with other technical analysis tools.
- Market Conditions: The effectiveness of the Evening Star pattern can vary depending on overall market conditions and the specific asset being traded.
Conclusion
The Evening Star candlestick pattern is a reliable tool for identifying potential bearish reversals at the top of an uptrend. However, traders should use it in combination with other technical indicators and seek confirmation before making trading decisions based solely on this pattern. Proper risk management and additional analysis are essential to mitigate the risks associated with false signals.


